Network Monitoring Tools
Explore a comprehensive set of features built to give you total control over your IT environment. This page provides an overview of the various tools available for tracking health, performance, and faults. It is a central hub for understanding how to keep your entire digital ecosystem running smoothly.
Networks are the fundamentals behind businesses worldwide. It plays a pivotal role in serving your employees for administrative purposes and your clients across the continents. The networks help you keep information in a centralized location - accessible to those who need it and restrict every other inbound request. So how do you provide continuous top-notch end user experience and maintain your rapidly evolving network? Only by monitoring the availability, health, and performance of your networks over time with the help of reliable, real-time network monitoring tools.
Why is ManageEngine OpManager considered one of the best network monitor software in the market?
OpManager is a powerful network management and monitoring tool that monitors switches, routers, servers, WLC, load balancers, VPN, printers, firewalls, VMs, Nutanix environments, and anything that has an IP and connected to the network - in a single console.
- Top Features
- Comprehensive Monitoring Capabilities
- Customer Reviews
Top Features
Real-time monitoring: Monitor network performance in real-time to preempt issues.
Automation tools: Automate routine tasks with intelligent discovery and rule engines.
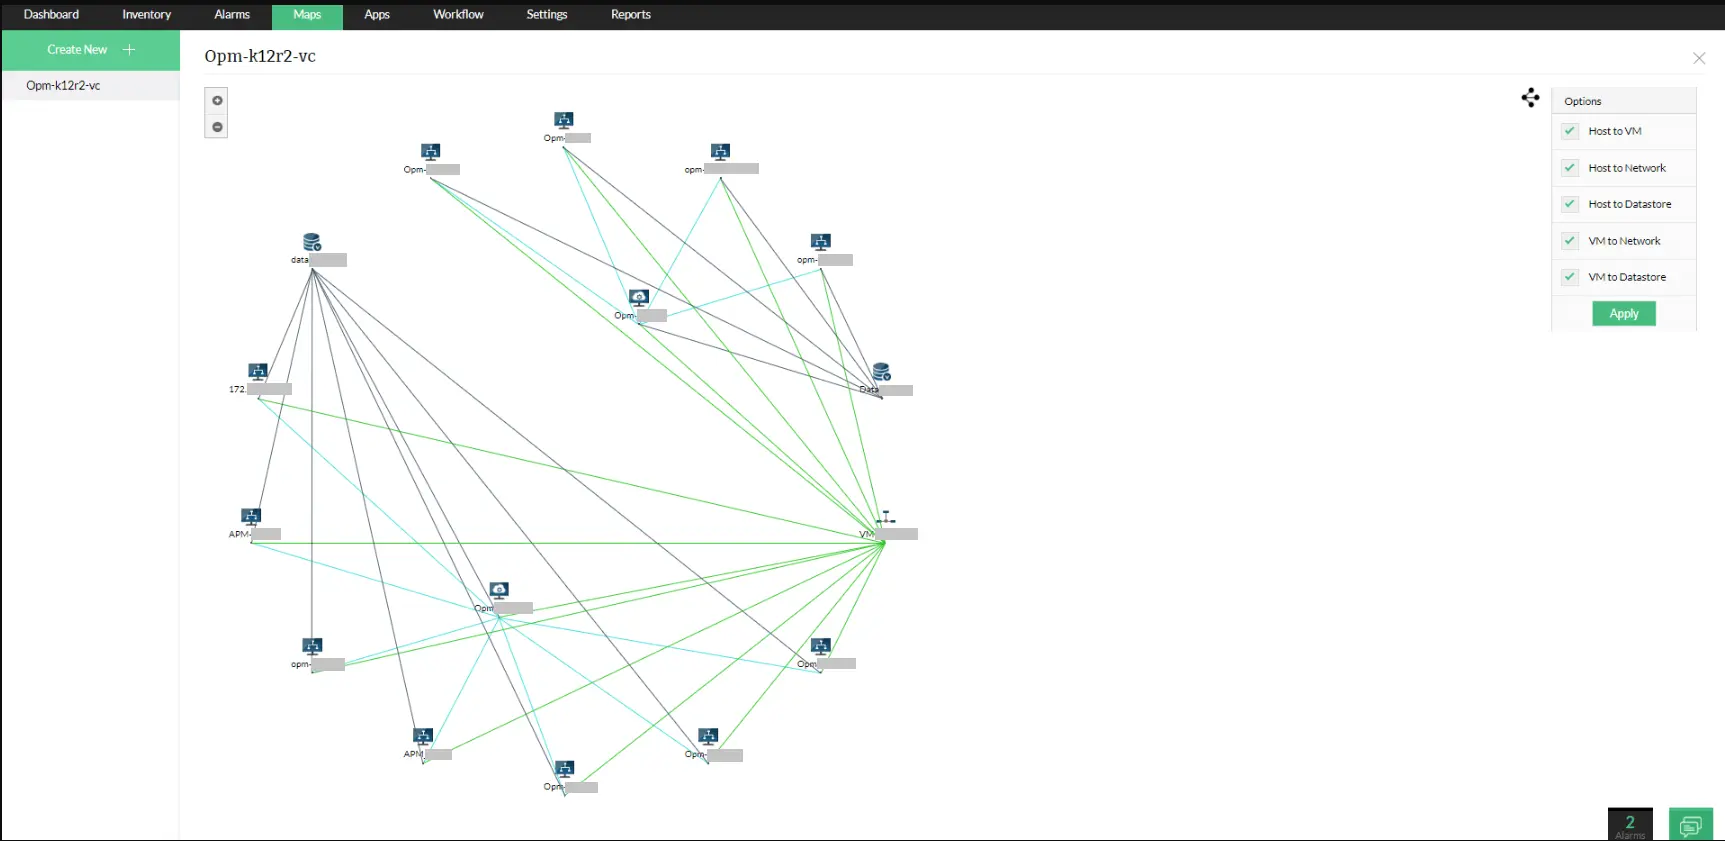
Automatic network mapping: Automatically map your network topology for better visualization and management.
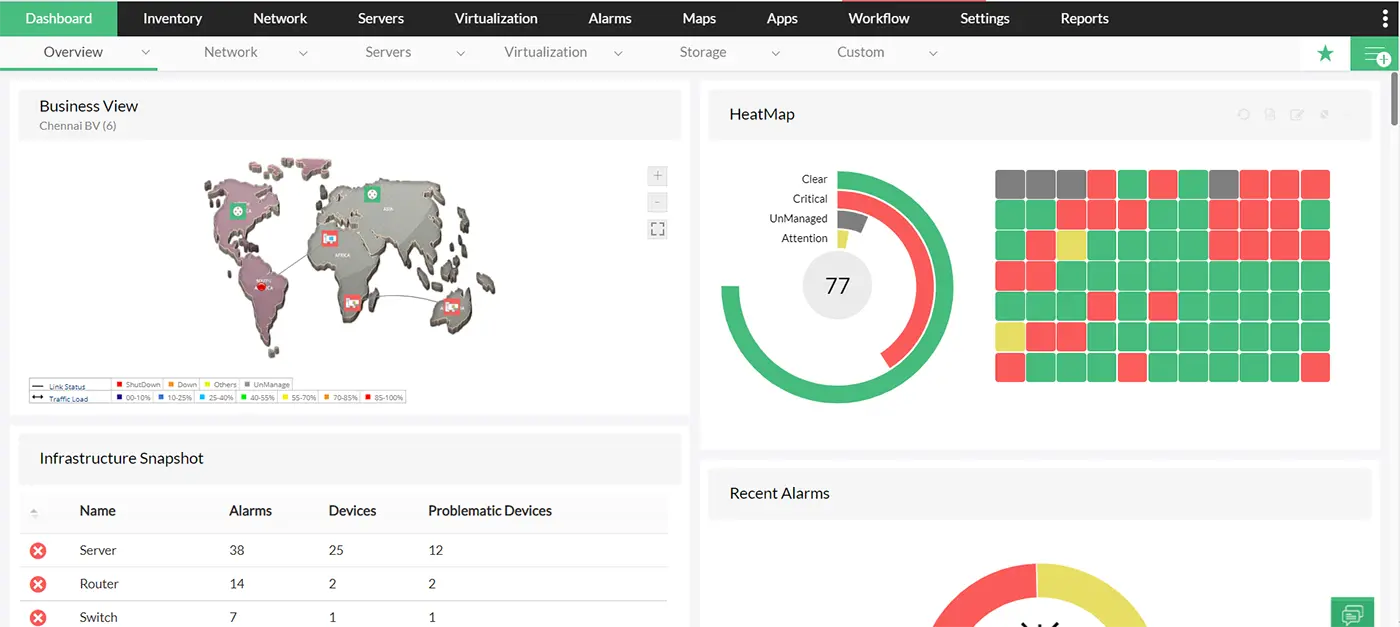
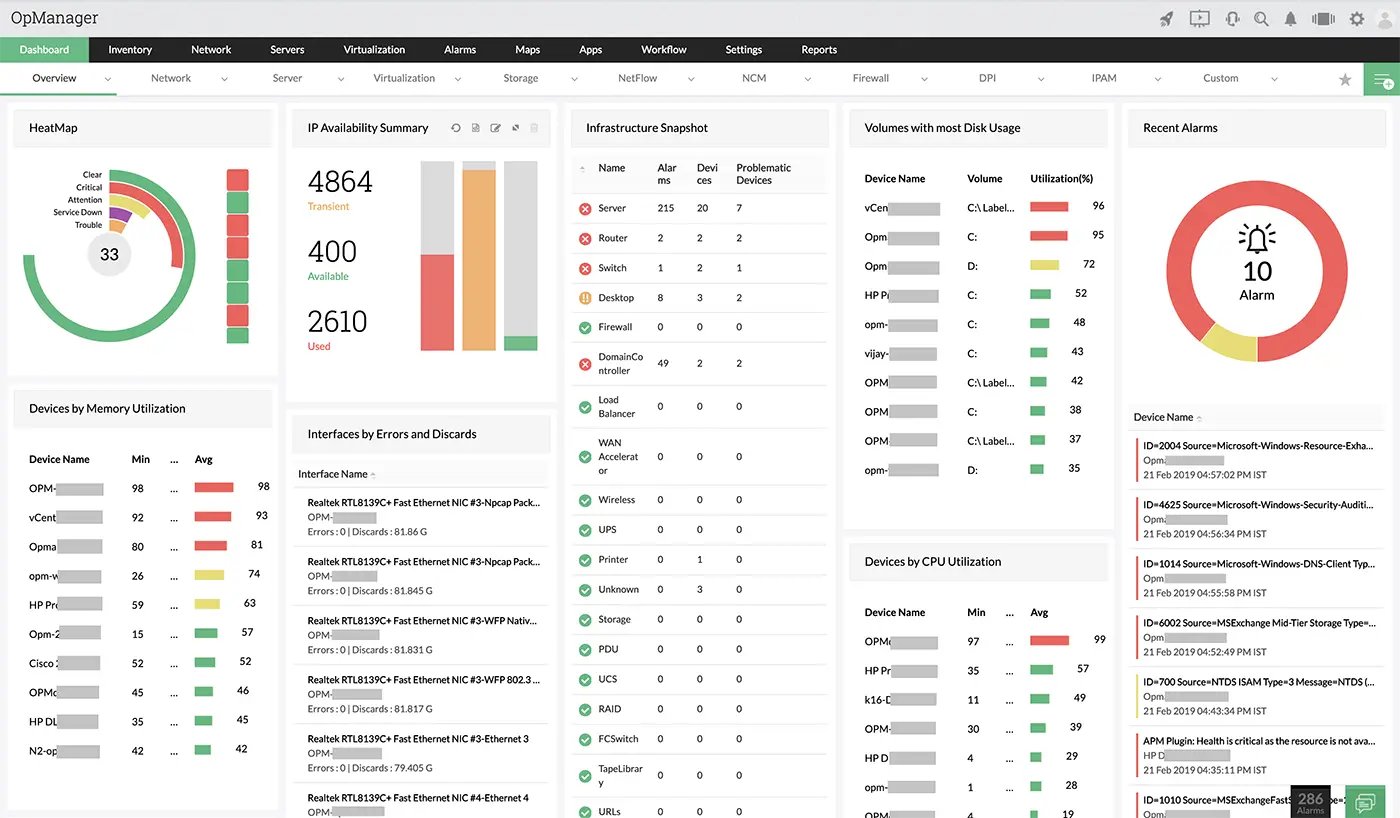
Custom dashboards: Create tailored dashboards and business views for easier fault identification.
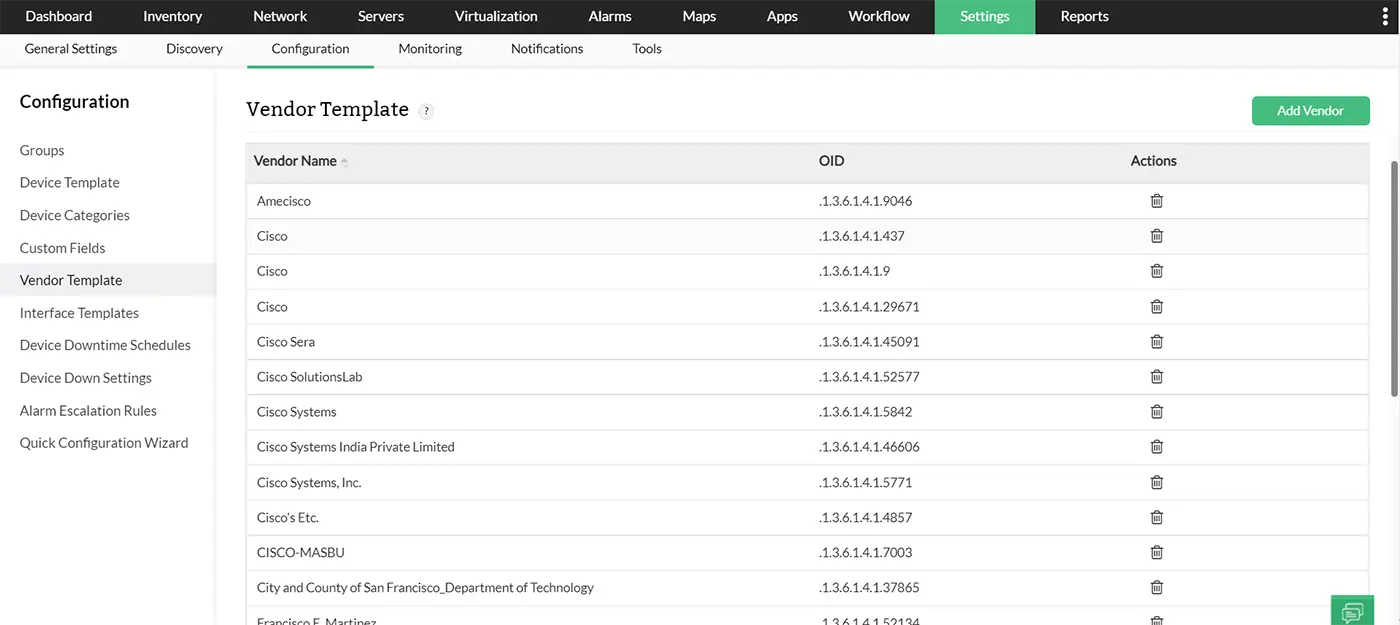
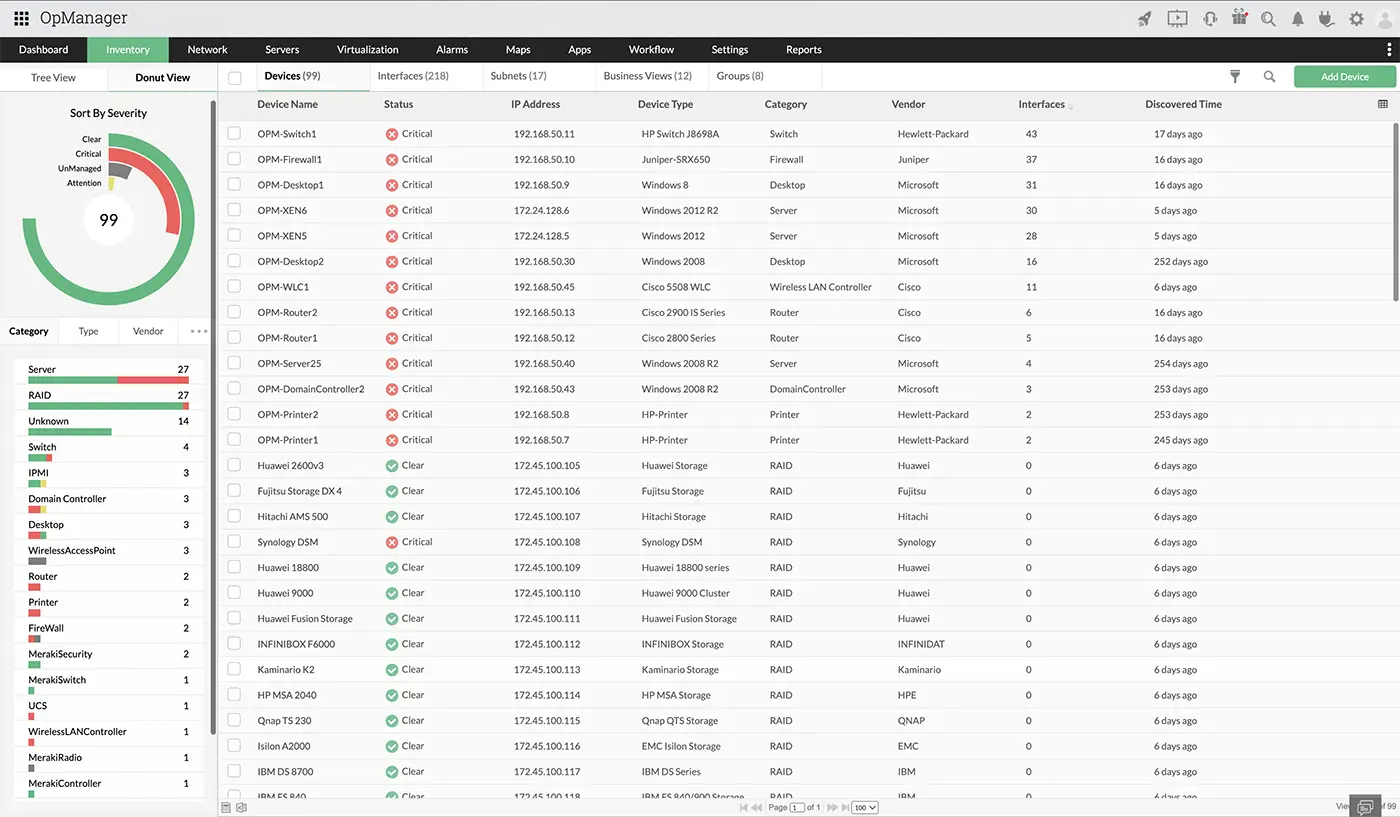
Extensive vendor support: Manage over 53,000 devices with pre-built templates.
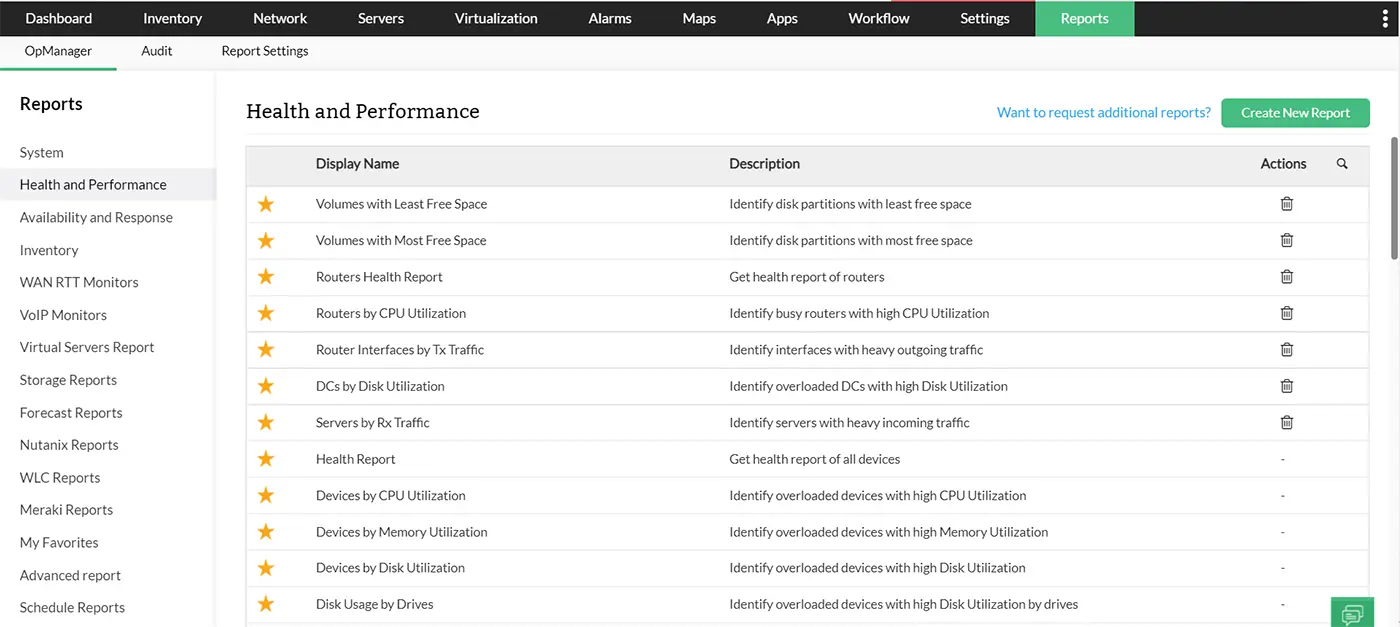
Over 100 pre-built network reports
Comprehensive monitoring capabilities
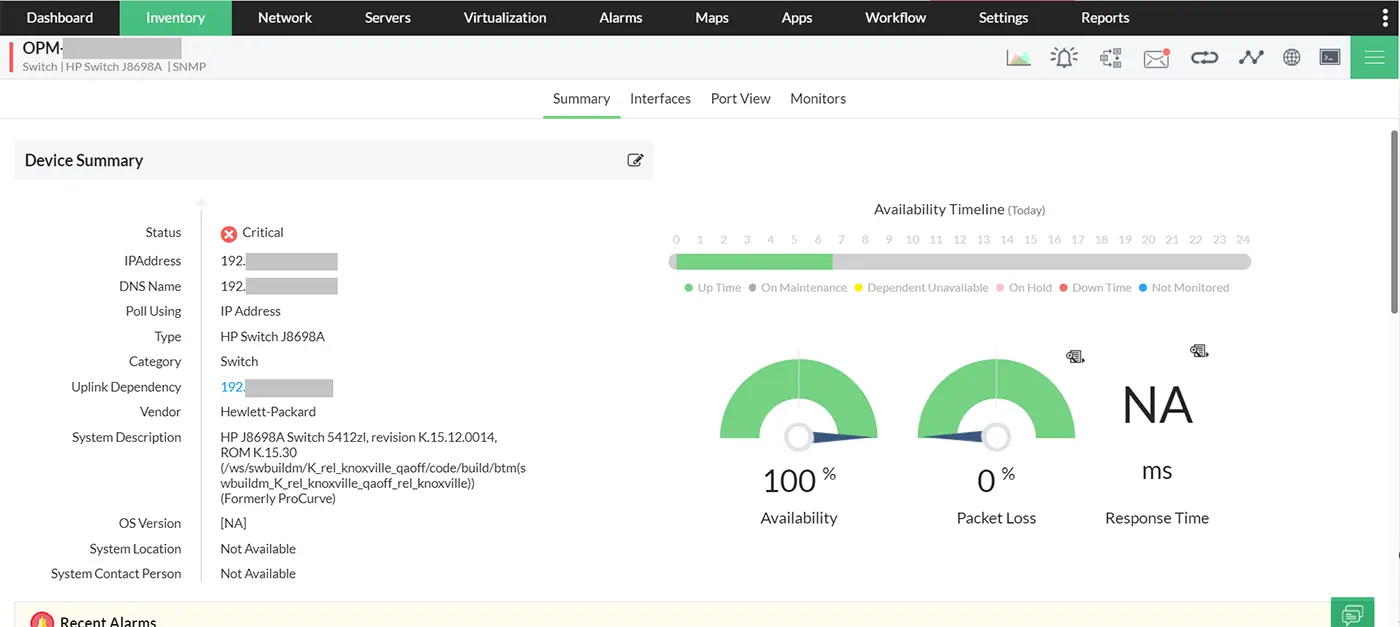
Switch/Router monitoring
Network switches and routers form the backbone of any IT infrastructure. Any issue with switch breaks the end user connectivity with the network. Using OpManager's network monitoring tool or network management tools, you can monitor switches, and routers from the likes of Cisco, Juniper, Aruba, ZTE, and many other vendors for availability, health, and performance in real-time for 2,000+ parameters and avoid possible network pitfalls. Apart from monitoring switches, OpManager maps switch ports to devices and monitors the availability of the switch ports.
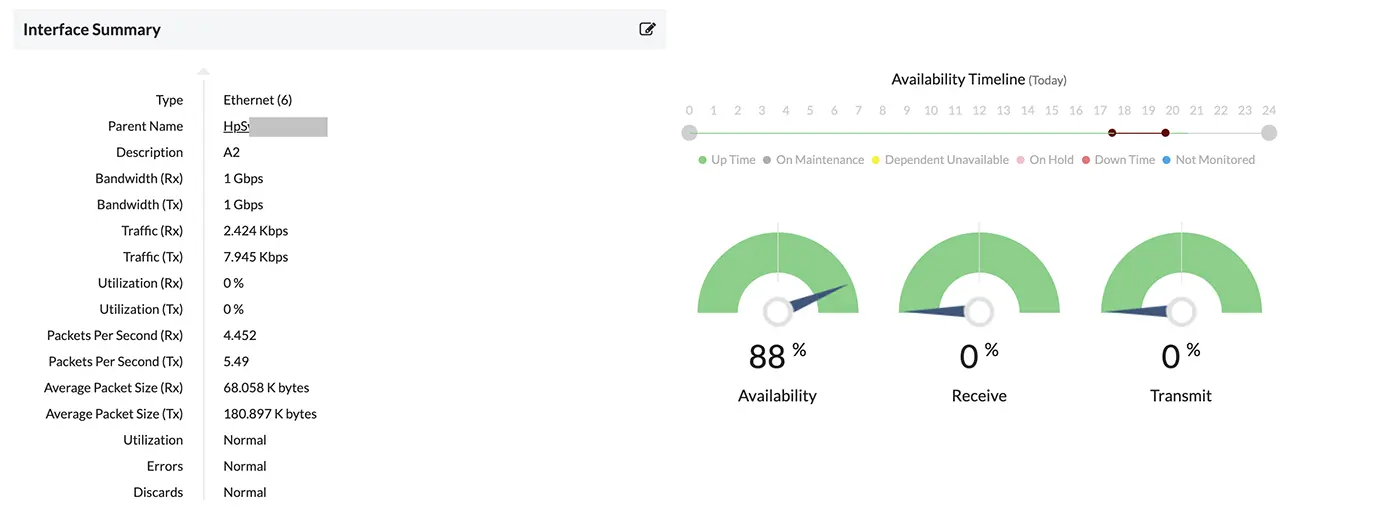
Network interface monitoring
Network interfaces are one of key performance indicators (KPI) as they help identify network performance degradation at the earliest. OpManager, the best network monitoring tool, monitors interfaces using SNMP and provides a single customizable dashboard to view and analyze bandwidth performance and network traffic for your IT network. You can monitor interfaces by checking the availability status of interfaces and monitor traffic speed on the interface, errors, discards, etc. using OpManager.
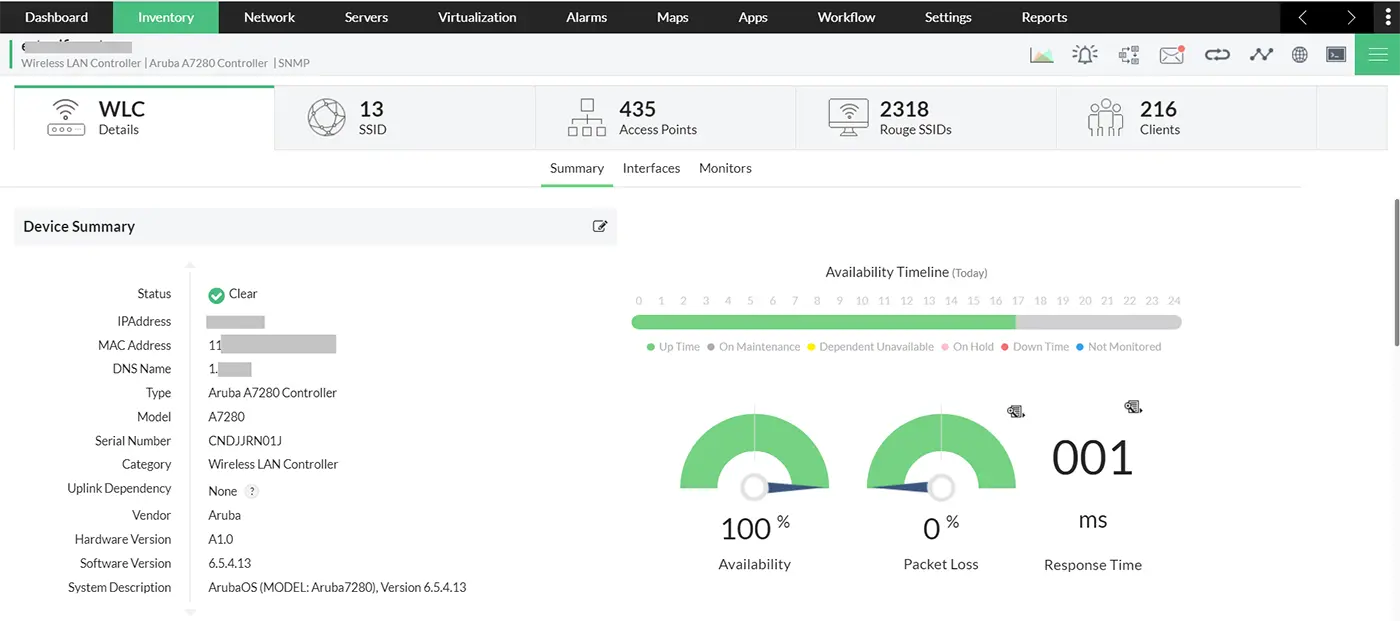
WLC monitoring
OpManager's multi-vendor WLC monitoring module allows you to keep your network intact by providing in-depth visibility of your wireless LAN controller (WLC), its associated service set identifiers (SSIDs) and access points (APs). Cisco's WLC monitoring tool in OpManager allows direct discovery of Cisco WLC and their associated SSIDs, APs and helps you monitor the overall performance of your wireless network with the help of Cisco WLC monitor. The WLC snapshot page provides inventory information, the device availability status, and other similar information. In addition, knowing the top five access points based on usage tells you who the top talkers are in your WLC environment, and custom dials display information on various parameters, including CPU and memory usage.
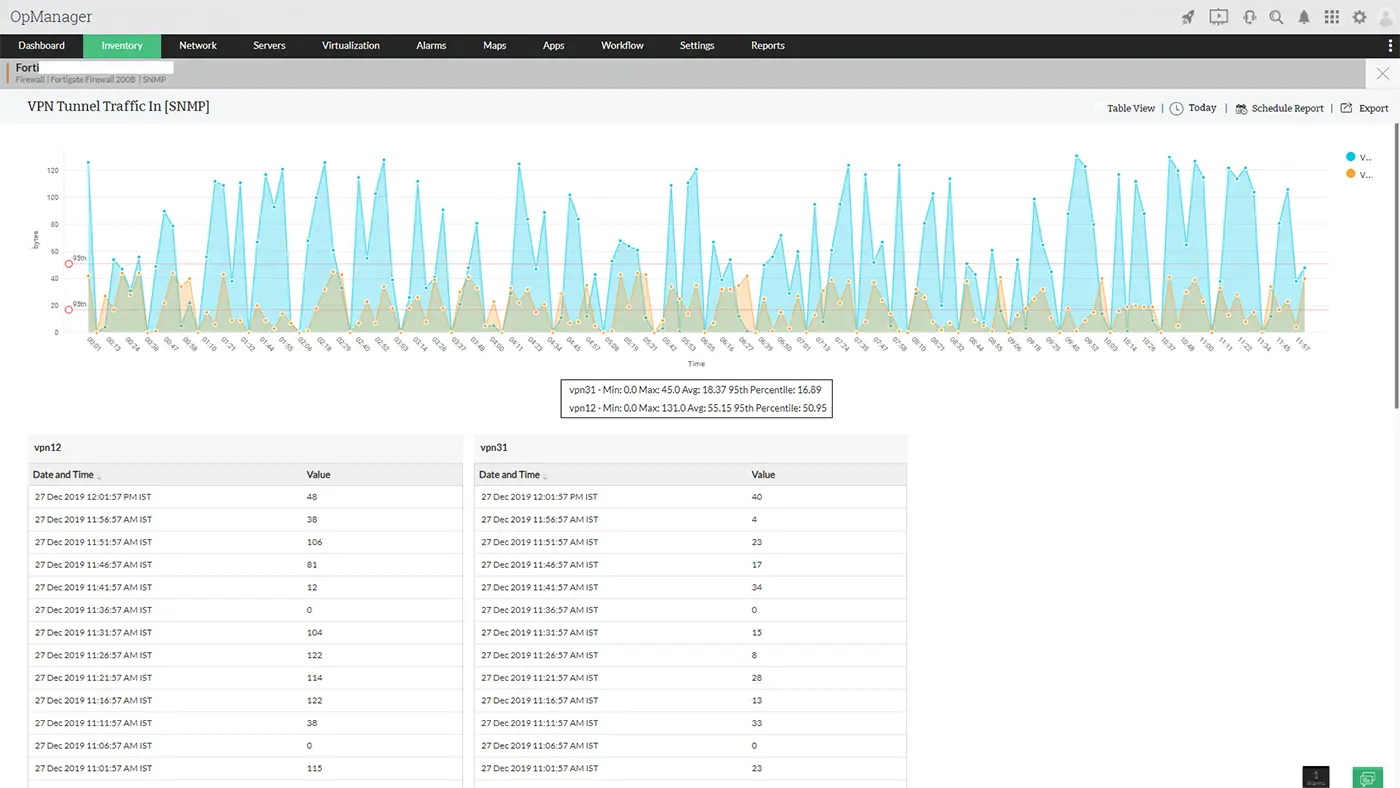
VPN monitoring
Organizations's network monitoring software allow connections into their networks through VPNs for their remote workforce. These connections can sometimes be compromised, resulting in data theft or network attacks. With a monitoring tool like OpManager, you can monitor your VPN by tracking the number of active VPN sessions, VPN tunnel status, and VPN tunnels count in real time, and also receive instant alerts on VPN connection regularities making your network secure and keeping your remote productivity issues at bay.
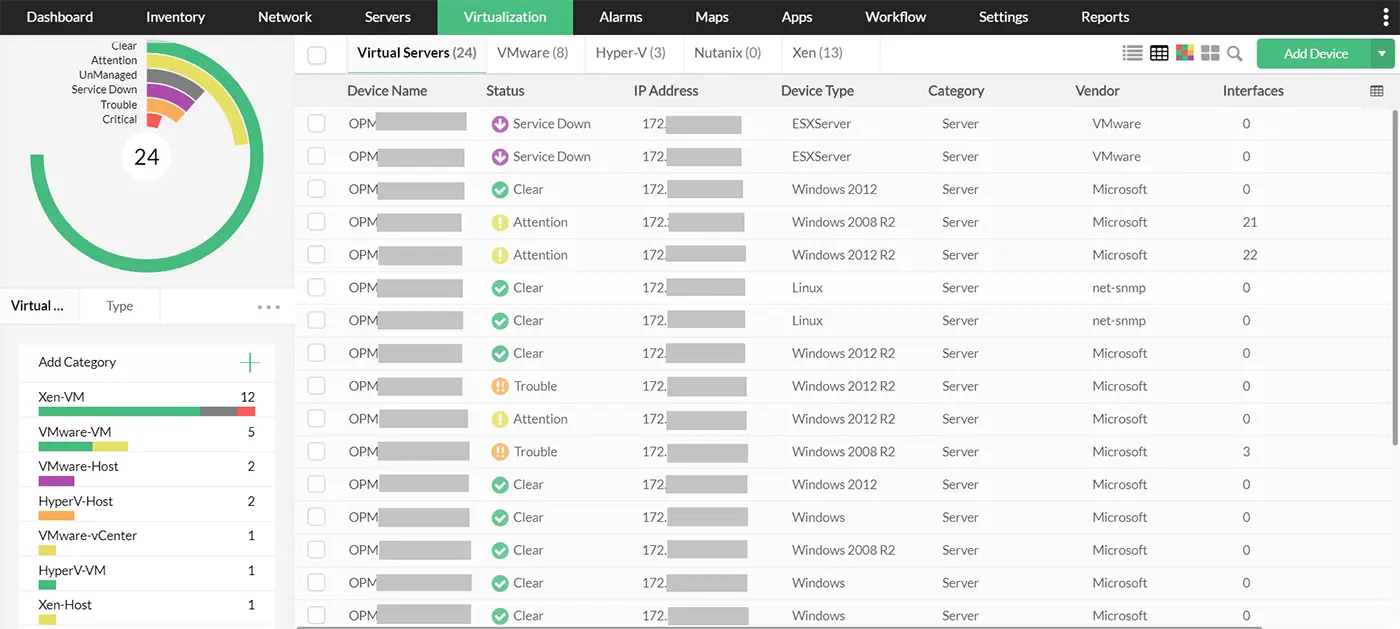
Hybrid environment monitoring
Every organization's network has unique needs, so top-of-the-line networking technologies are employed to address them. This helps networks deliver business services but also poses a challenge with monitoring and managing the network. Using multiple network management tools is not efficient and cost effective. With OpManager, apart from monitoring switches, servers, etc., you can monitor VMware, Hyper-V, Hypervisors, Cisco UCS, Nutanix infrastructures, and more, all within a unified console, making it the best network monitor. Additionally, you can monitor your WAN with Cisco IP SLA using OpManager.
Mobile application
Access your OpManager's network monitoring and reporting anytime and anywhere using the new ManageEngine OpManager mobile application. Available for both Android and iOS, this lets you visualize your infrastructure, act on the alerts, drill-down to the root cause of the problem without having to be physically present in your server room to resolve a fault!
OpManager, the one-stop network monitoring solution
Apart from the above, OpManager, your comprehensive network monitoring solution monitors Windows servers, Linux servers, storage devices, Windows services, processes and scales upto 30,000 devices out of the box. This network software makes network monitoring effortless with intelligent automations, ML-based forecasting, and extensive protocol support. Here are some of OpManager's network monitoring applications:
Keep your network up and running 24/7 with OpManager's network monitoring software.
Keep a track of every activity on your network in real-time and minimize downtime and the mean time to resolve (MTTR).
Monitor hardware components such as battery, fan speed, power supply, temperature, disk array, clock speed and more with OpManager.
Ensure maximum network performance by detecting memory usage fluctuations and keeping memory utilization in check.
Monitoring your LAN devices and their subnets is made easy with OpManager. You can even visualize the LAN environment and find network outages and fix them instantly.
Get insights on WAN link latency, bandwidth utilization, Round–Trip–Time and other performance factors to plan WAN bandwidth capacity and resolve issues faster.
Track network latency to prevent unforeseen network lags and ensure uninterrupted network operations to the end-user.
OpManager supports wide range of Cisco devices such as ASR series, Catalyst series, Nexus, UCS etc., Monitor and manage them all from a unified network monitoring tool, OpManager .
Easily visualize your entire network topology with OpManager's network maps and floor and rack views. This way, you can easily locate and isolate network issues to initiate faster troubleshooting.
Detect, isolate and troubleshoot network issues even before the end-user knows them, with OpManager's fault management capabilities.
Monitor your storage devices such as RAID, Tape Libraries, Fabric switches proactively. With dedicated dashboards and reports, storage monitoring is now even more convenient.
FAQs on network monitoring tools
What are network monitoring tools?
-Network monitoring tools track, analyze, and report on the performance of networks, including hardware, interfaces, storage devices, and virtual environments. OpManager simplifies this with an intuitive dashboard, real-time alerts, and actionable insights.
Why are network monitoring services important?
+Network monitoring ensures continuous visibility, real-time updates, and early detection of issues, enhancing business continuity.
How do network monitoring tools work?
+These tools collect data through network protocols, monitoring metrics such as traffic, bandwidth utilization, availability, and packet loss. They help administrators visualize network activity and diagnose issues.
How scalable is OpManager as a network monitoring tool?
+OpManager is designed to grow with your business, supporting networks of all sizes with distributed monitoring architecture.
Which network monitoring tool is best for fast network outage detection?
+ManageEngine OpManager is one of the best network monitoring tools for fast network outage detection. It uses real-time monitoring, intelligent alerting, and AI-driven analytics to quickly identify outages, isolate root causes, and reduce mean time to resolution (MTTR). With support for both active and passive monitoring, it ensures network issues are detected instantly, helping IT teams minimize downtime and maintain continuous network availability.
Why OpManager is the leading network monitoring solution in the IT market?
+