Businesses with workplaces spread across multiple global locations share and receive data via a WAN link. This demands continuous monitoring of network quality across widespread network locations and paths in order to achieve optimized performance levels and uninterrupted service delivery.
IP Service Level Agreement
An IP service level agreement, or IP SLA, is a network measurement technology that simulates network traffic and IP services by generating continuous, reliable, and predictable data across multiple network locations/paths, and uses the statistics collected from the simulation to analyze the performance of a network in real time. The collected information is time-based, and is used in actively monitoring and troubleshooting a network.
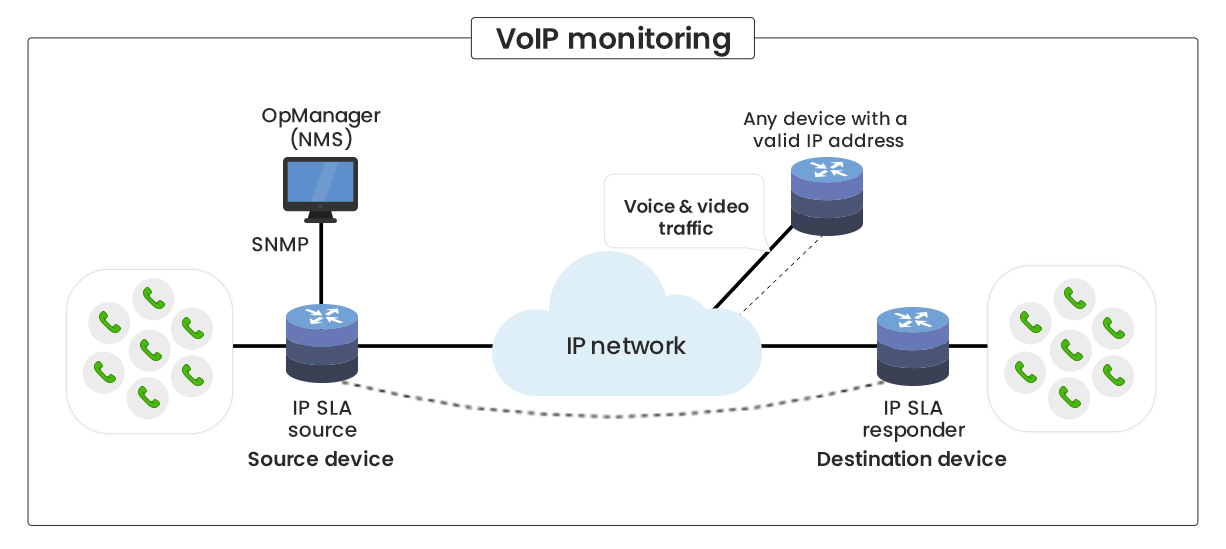
To do this, an IP SLA source (an IP SLA router or a switch) sends data packets across the network, to a destination (any device with an IP). The destination device acknowledges the received data packets, and on the basis of the type of IP SLA operation, responds with a timestamp information which is used by the IP SLA source to measure various performance metrics. If the destination is an IP SLA enabled device, it is called as an IP SLA responder, which is capable of providing much more accurate and functional measurements than a non IP SLA destination device. Cisco IP SLA technology and IP SLA monitors are widely used by leading network service providers and IT admins.
Cisco IP SLA in OpManager
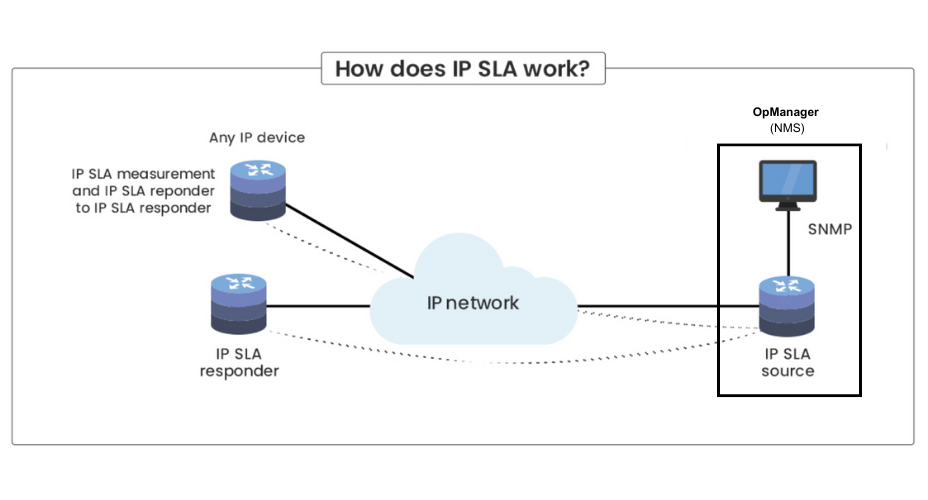
OpManager uses Cisco IP SLA technology to provide uninterrupted, real-time data on the performance of your network by continuously monitoring the traffic in the environment. Businesses utilizing IP applications and services are backed up by Cisco IP SLA monitoring tools to actively monitor IP SLA performance and ensure round the clock availability.
Be it the bandwidth on the key link of your network, the call quality, or the voice over IP (VoIP) traffic, IP SLA monitoring provides clear visibility into your networks and also helps in active troubleshooting. IP SLA performance or the performance of a network in general, is based on three parameters:
- Latency or response time: The time it takes for a message to travel from the source to reach the destination is known as latency. Higher latency is a result of the poor performance of a network. Increasing traffic in the network may cause high network latency.
- Jitter: Jitter is the inter packet delay variance between arriving packets. In other words, it is the difference in latency between data packets. This variation occurs when the data packets are queued, or due to configuration errors in the communicating devices.
- Packet loss: The data loss that occurs during the travel of data packets from the source to the destination is referred to as packet loss. The more packet loss, the poorer the connection. Data loss may occur due to network congestion, software bugs, or problems with network hardware.
- Round trip time (RTT): As an inclusive measure of the overall latency of a network, it is the entire time (in milliseconds) required by a packet to travel from a specific source to a specific destination, and back again.
- Connectivity: It is a measure of network health between two end points. This metric is calculated by continuously monitoring the link availability between two devices, to check whether the link is reachable.
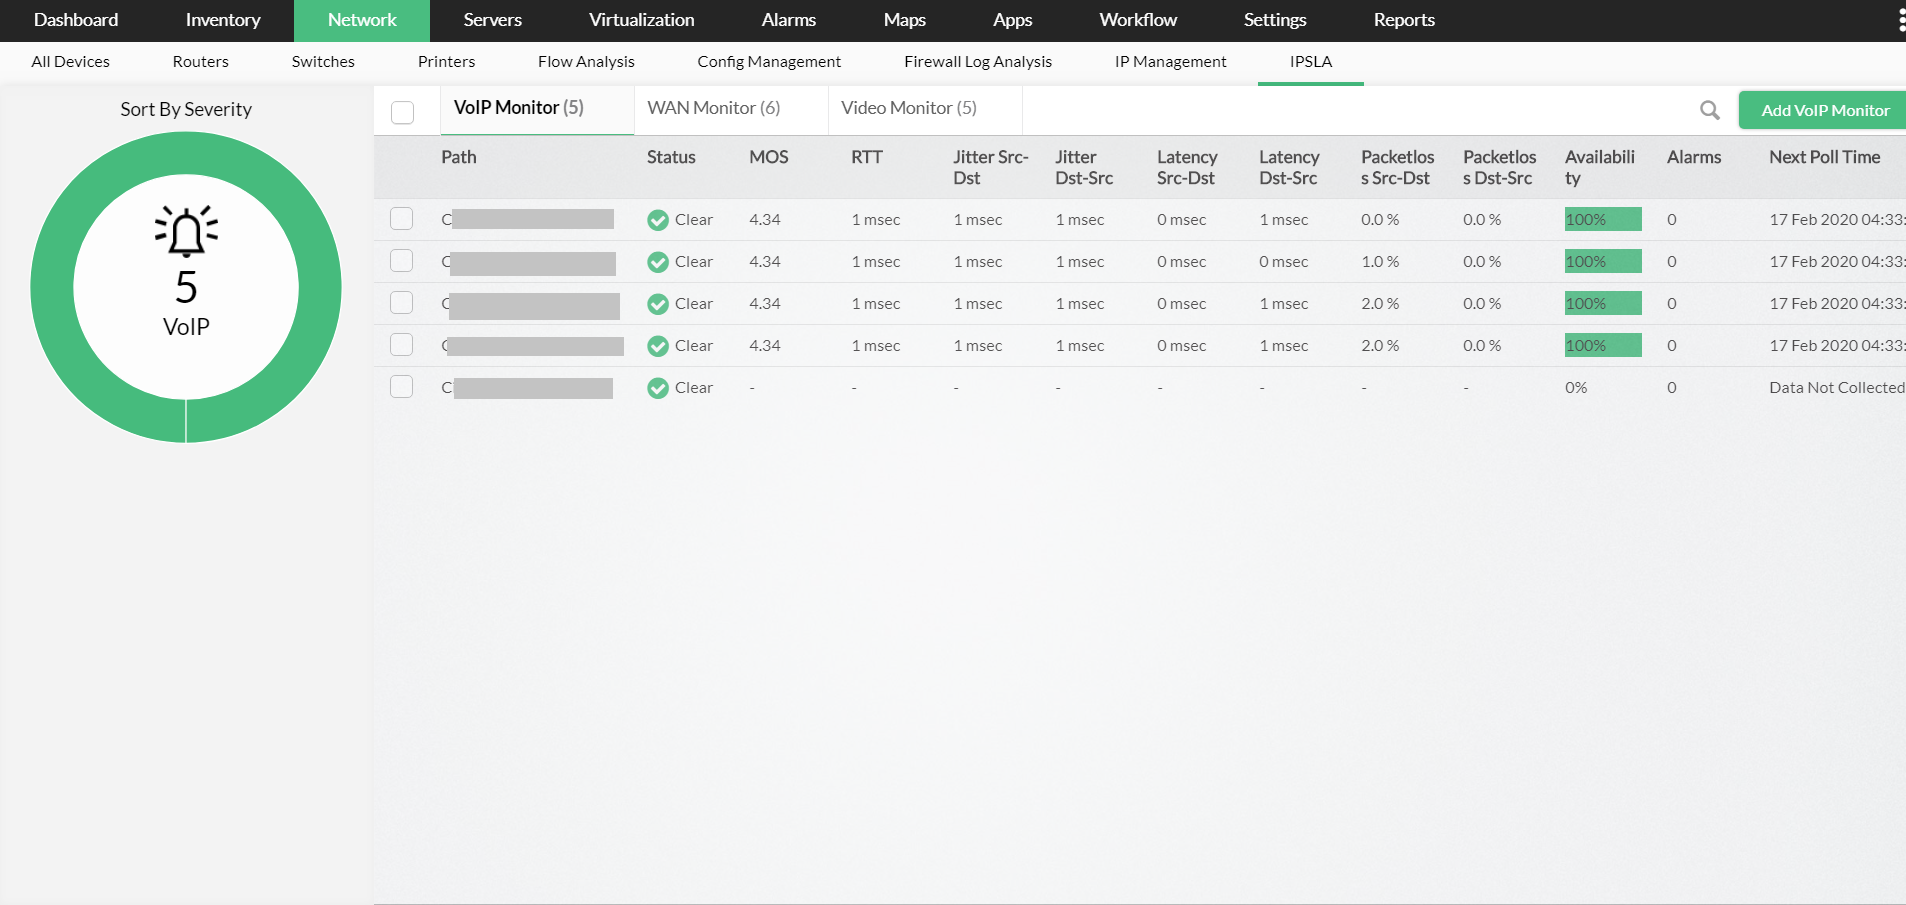
- Voice quality scores (MOS Value): Mean opinion score (MOS) is a standard for measuring the quality of voice across the audio calls on a network. The MOS value is dependent on the codec that is used for the transmission of Voice packets over IP; and the higher the value, the better is the voice quality.
IP SLA operations in OpManager
OpManager's IP SLA monitor supports the following operations.
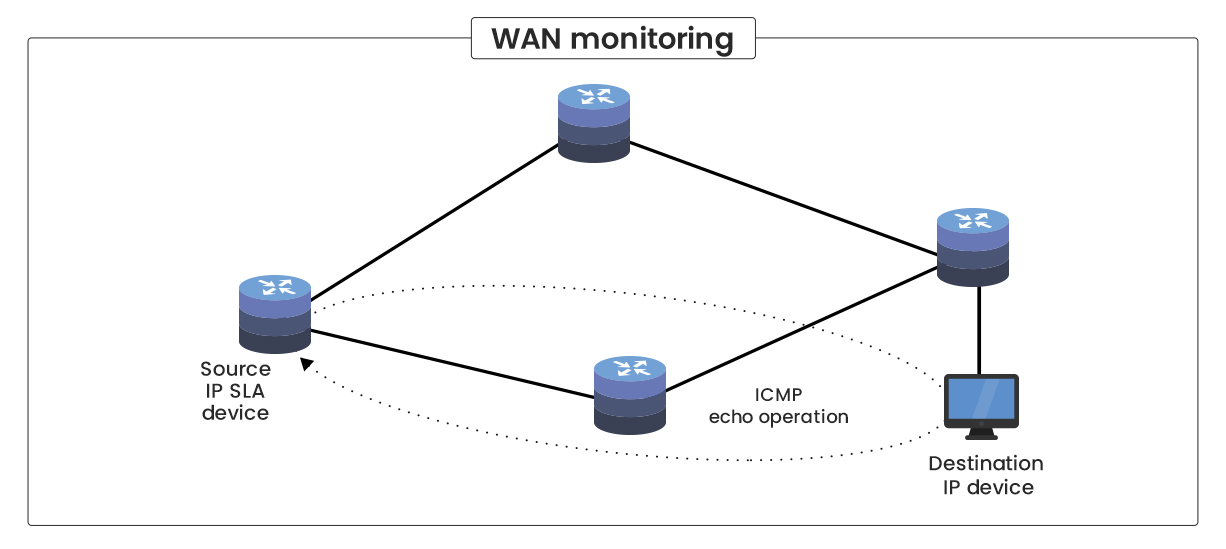
- ICMP Echo operation: For WAN RTT monitor
- ICMP Path Echo operation: Used for traceroute or hop by hop monitor
- UDP jitter operation: For VoIP monitors
- Video operation: For video monitors
Advantages of using OpManager's IP SLA monitor
Here are a few advantages in leveraging OpManager's IP SLA monitor.
Proactive Performance Monitoring
- Periodic monitoring of WAN links and the supporting devices to ensure uninterrupted connectivity.
- In-depth quality of service (QoS) visibility over call paths within WAN range and between corporate users.
- Continuous monitoring of the VoIP service performance by varying the traffic loads.
- Automated monitoring of network health with end-to-end monitoring of the source and destination devices.
Reports and scheduling
- Detailed reports on errors, utilization, SLA violations, and the performance of the top 10 call paths.
- Historic reports on jitter, latency, mean operation score (MoS), and round-trip time (RTT).
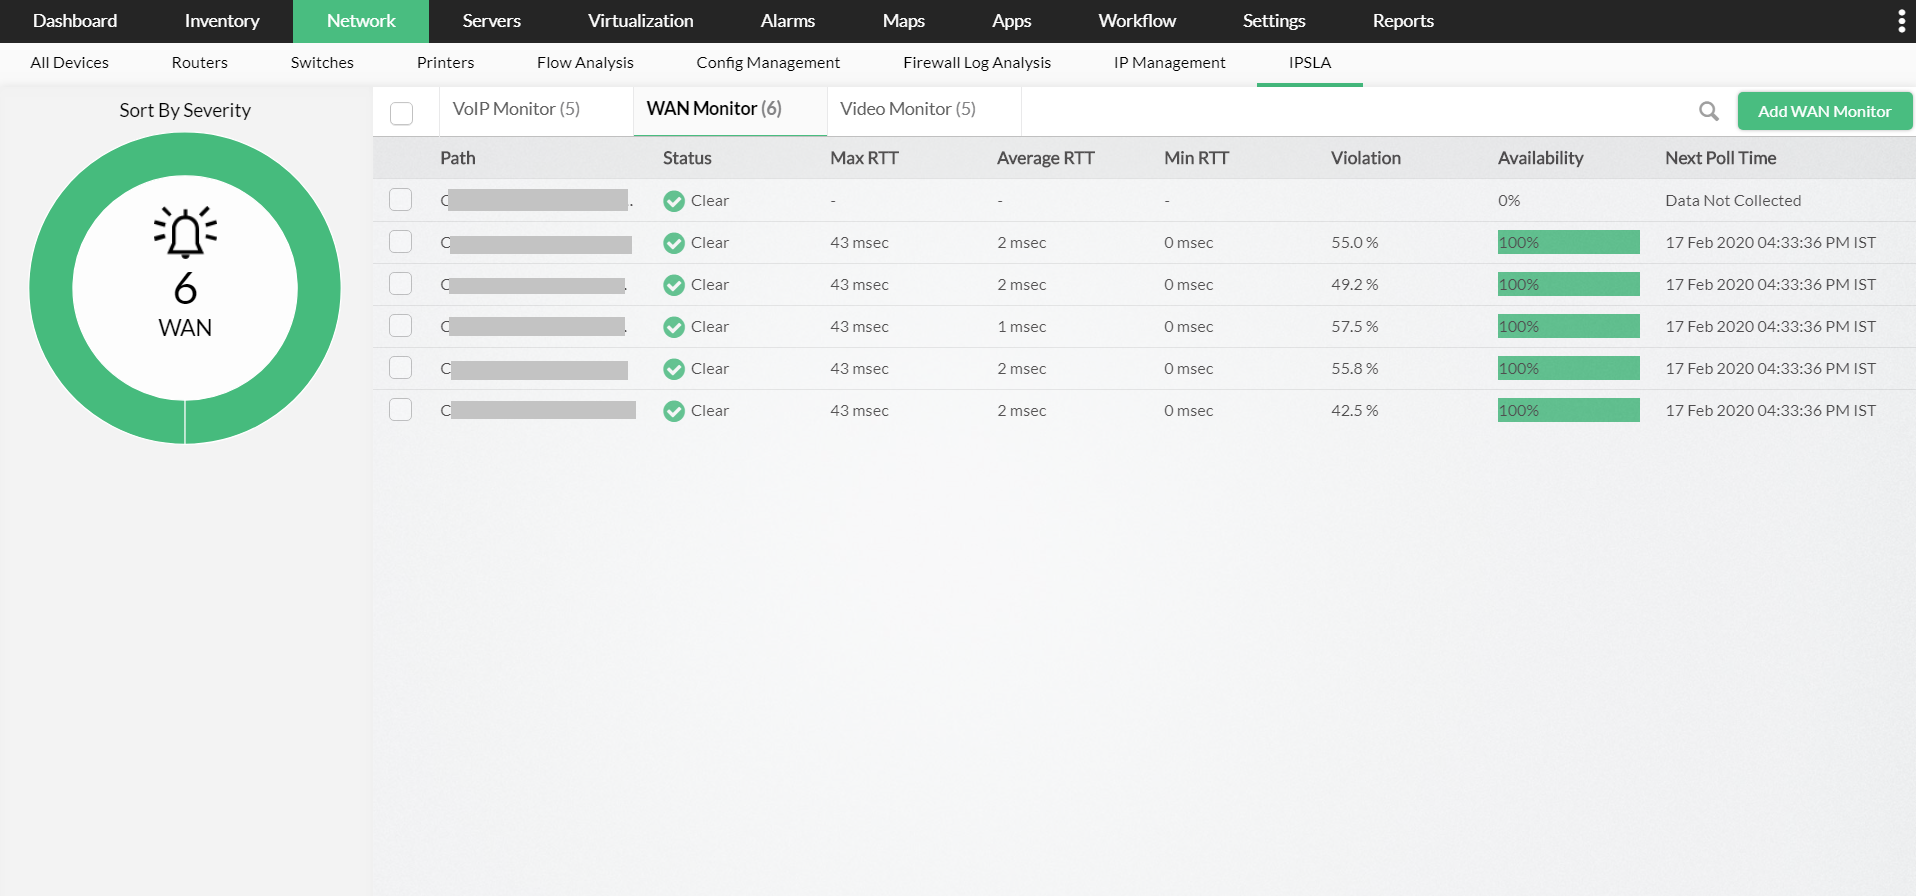
- Real-time reports on threshold violation, maximum RTT, and availability.
- Custom report generation on various metrics concerning performance and quality.
- Report scheduling for regular and timely insights into the performance of IP SLA devices and their associated metrics.
Quick Troubleshooting
- Continuous monitoring of service levels to forewarn users about all the liable errors and complications with the help of IP Service Level Agreement (IP SLA) monitors.
- Quick and easy troubleshooting mechanisms to keep response times in check.
VoIP Monitoring
VoIP technology works by converting the analog voice signals into digital signals, and in turn breaking them down into IP packets. These packets are then transferred over the internet, reassembled in the same order, and played as audio signals on the receiver's end. The VoIP monitor in OpManager helps monitor voice call quality between two remote sites by simulating synthetic traffic to analyze various parameters like latency, MOS, RTT, jitter, and packet loss.
WAN Monitoring
The WAN RTT monitor in OpManager helps monitor the performance of your WAN link by simulating organic traffic, which in turn helps you figure out the round trip time (RTT) for that particular path. RTT is the time taken for a data packet to travel from its source to the destination and back. RTT helps in putting together statistical data on the availability and reliability of the entire network.
Alerts and Notifications
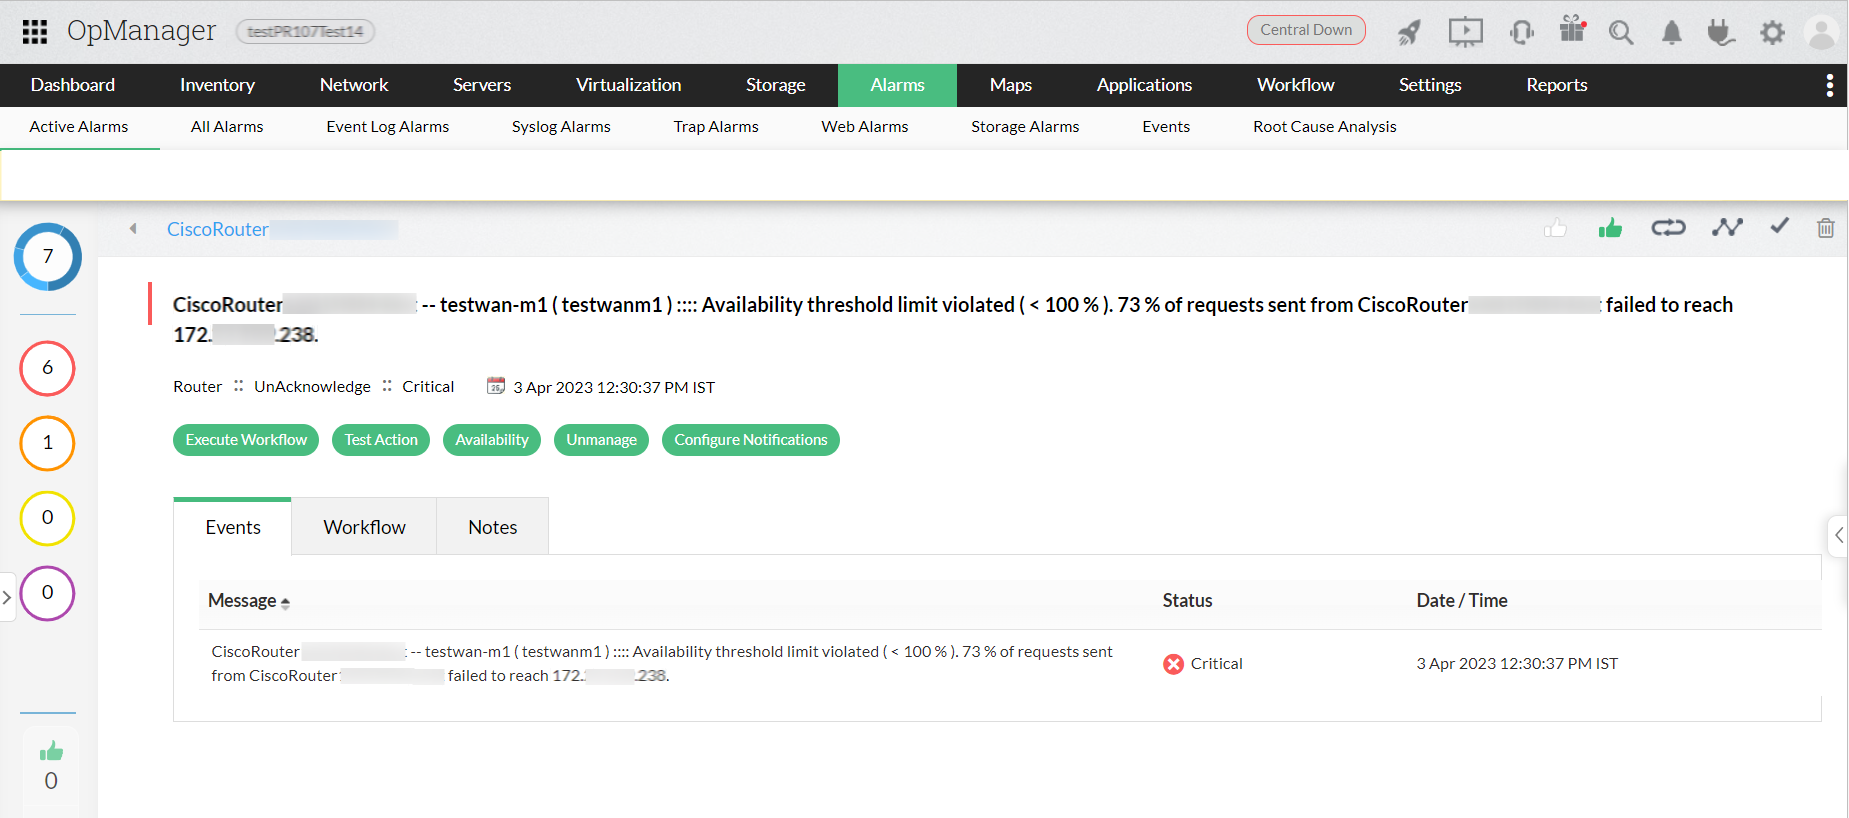
Being able to monitor the performance of IP SLA devices is just not enough. You need to have visibility into errors and violations when they occur. With flexible threshold configurations, OpManager's IP SLA monitors continuously track service levels and generate instant alerts when violated. Establish upper limit thresholds for VoIP, WAN, and video metrics to trigger alarms when their collected values exceed the configured limits.
Achieve in-depth visibility and control over your entire network. For more information on how OpManager can help effectively monitor your entire network, try a 30-day free trial, or register for a free demo.
Make your network monitoring simple and efficient!
Download OpManager nowCustomer reviews
More than 1,000,000 IT admins trust ManageEngine ITOM solutions to monitor their IT infrastructure securely
Case Studies - OpManager
Awards & Honors
- Recognized as a May 2019 Gartner Peer Insights Customers' Choice for Network Performance Monitoring and Diagnostics Software
- Recognised as an April 2019 Gartner Peer Insights Customers' Choice for IT Infrastructure Monitoring Tools.
- Network Management and Monitor Vendor of the Year 2018, 2019
- Entered the 2019 Gartner NPMD Magic Quadrant.
- Ranked #2 in the Infotech Research Software Reviews Data Quadrant 2018.

