Computer networks form the basis of digital businesses. To ensure business continuity, the IT infrastructures behind these networks need to be monitored and managed night and day. IT admins often run into problems while managing IT infrastructure, a key part of their work. An even more important part is troubleshooting network issues. While reading further, we will discuss:
- What is network troubleshooting?
- Network troubleshooting basics.
- How to troubleshoot network issues with OpManager.
- Common causes of network problems.
- Troubleshooting toolkits within OpManager.
What is network troubleshooting?
Network troubleshooting is the systematic process of identifying, analyzing and resolving network issues. In other words, troubleshooting network issues refers to rectifying problems related to connectivity, security, performance and other aspects of networks. Network troubleshooting is essential to reduce MTTR, restore network uptime and regularize network operations.
Network troubleshooting basics
Types of network issues
Hardware issues
Performance issues
Hardware unavailability and performance issues are the major network problem that is often due to device misconfigurations and hardware load. Common hardware issues include sudden spike in temperature, improper ventilation, fluctuations in voltage/ power supply, abnormal processor speed, poor battery etc., These hardware problems can adversely affect network health, leading to unforeseen downtime or network outages, for which hardware monitoring is essential.
Physical connectivity issues
One of the major network issues could be poor physical connectivity due to defective cables or connectors. This happens when a network cable is broken, cabled loose, or accidentally gets disconnected and creates network issues on the devices to which they are connected.
Finding the root cause of the issue, in this case, includes checking each and every cable one by one, which is a real task. The easy and recommended way would be monitoring all network interfaces with a network performance monitor like OpManager.
Software issues
Software issues such as service unavailability, process unavailability, OS issues, and slow service response time could harm server availability and health and in turn, the uptime and performance of business critical applications. This affects end user experience which costs the business its reputation. This creates the need to monitor applications and services from time to time and prevent software issues.
Bandwidth issues
Bandwidth is an important metric that defines the network's ability to transfer data between devices or the internet in a given span of time. Higher bandwidth means faster data transmission across a network that keeps many devices connected all at once. When large application runs, it causes network congestion, which creates the risk of insufficient bandwidth for other network devices. This in turn results in slow download speed over the internet.
Causes of high bandwidth include unstable WAN links, poor VoIP calls due to jitter, latency and packet loss, larger downloads, file sharing, etc.,
DNS issues
DNS issues are the network problems that network admins tend to overlook sometimes, but are very common too. DNS issues occur when you're unable to access internet or connect to an IP address. Few hours offline can create negative impact on end users and the businesses that depend on you. This is why it's important to identify and fix DNS problems at the earliest with a network management software. DNS issues could also be due to poor DNS configurations, high DNS latency, high TTL values, hardware or network failures etc.,
Configuration issues
Whenever you configure or re-configure a device, connect to VLAN or VPN networks, or upgrade hardware on your network, you need to make sure that the devices are configured correctly in order to ensure smooth functioning of your network. Many network problems are due to device misconfigurations that can have an effect on different parts of the network and create major problems. To prevent such issues, you can rely on network monitoring application that helps monitor and manage device configurations.
Firewall and IP management issues
Firewall management
Enterprises have multiple firewalls in their network wherein each firewall will have unique configurations and rules. Managing and organizing these rules without being overlapped and ensuring the rules are up-to-date is a real task. Failing to do so, will make the network vulnerable to threats for which firewall monitoring is pivotal.
IP management
In a network, no two devices can share the same IP address and when it happens, neither systems can connect to the network. Detecting and managing such rogue IPs is important for the network to function optimally.
How to troubleshoot network issues?
IT admins need to be prepared to handle network issues and reduce their mean time to repair (MTTR). To achieve a lower MTTR, you should have a clear understanding of network issues. The four-step method discussed below can help you better understand underlying network problems and solutions, prevent network troubleshooting issues and maintain a five-nines network.
Step 1: Identify the network issue.
Step 2: Gather information and track the root cause.
Step 3: Troubleshoot the issue.
Step 4: Document the issue, the process and the network troubleshooting solutions.
By following the routine above, you can clearly understand network issues and teach other network technicians about possible network pitfalls and the necessary troubleshooting steps. However, the real challenge is identifying and troubleshooting network problems before end users are affected.
OpManager: Diagnose and troubleshoot network issues faster than before
ManageEngine OpManager is comprehensive network monitoring and network troubleshooting software. It helps you diagnose network issues in switches, routers, servers, and storage devices for availability, health, and performance. OpManager also monitors response time, services, processes, and other hardware metrics, along with packet loss monitoring. By providing real-time insights into your network, OpManager helps you identify and troubleshoot network issues before end users are impacted.
How to troubleshoot network issues with ManageEngine OpManager?
Identifying network issues swiftly is crucial for preventing major downtime. OpManager efficiently identifies and troubleshoots network issues across various devices, including application servers, routers, switches, WLAN controllers, and more. For example, when OpManager alerts you of an application server's CPU utilization, you can:
- Immediately locate the application server.
- Analyze the CPU utilization spike.
- Track the processes responsible for the CPU utilization spike.
- Remotely kill the processes.
OpManager also enables proactive fault management by allowing you to swiftly identify network issues with its comprehensive set of features, including Root Cause Analysis, Network Path Analysis, Adaptive Thresholds, network topology maps, and troubleshoot network issues with features such as Workflow and networking toolsets such as ping, MIB browser, trap viewer and so on.
Root Cause Analysis:
The initial step in troubleshooting network issues involves analyzing the root cause of the problem. OpManager's Root Cause Analysis enables network administrators to establish an RCA profile, facilitating the aggregation and correlation of performance metrics and other crucial monitors from network devices within a unified console. OpManager's RCA further enhances this process by offering graphical visualization to highlight alert spikes across various monitors of network devices. Additionally, it empowers network administrators to promptly address issues by creating RCA profiles integrated with alarm data, allowing for immediate troubleshooting upon threshold violation.
Network Path Analysis:
OpManager's network path analysis tool facilitates visualizing and monitoring network path performance, offering features like traffic pattern visualization and hop-by-hop analysis. By utilizing TCP requests, OpManager identifies critical paths, tracks packet transit time, and predicts potential outages. With comprehensive visibility, historical data analysis, and customizable alerts, it ensures uninterrupted network connectivity.
Adaptive Thresholds:
OpManager's adaptive thresholds simplifies threshold setting by dynamically adjusting to the changing performance of network devices. Using predictive algorithms and machine learning, it forecasts reliable values for setting thresholds across network devices, eliminating the need for manual analysis. This method requires minimal setup effort and ensures efficient monitoring by adapting to periodic trends in performance metrics, therefore enabling effective fault management and troubleshooting.
Common causes of network problems and how to fix them with OpManager
Network admins commonly have to troubleshoot network problems involving:
The underlying causes of these network issues, as well as their solutions, are discussed below.
1. Slow internal network speeds
Jammed requests: A large number of requests at the same time causes slow network speeds. This can be fixed by adding more bandwidth to your network, usually by renegotiating with your ISP.
Multimedia streaming: Streaming or downloading large files over extended periods causes a network slowdown, affecting other critical business functions. You can block media streaming sites behind the firewall. Apart from blocking such sites, you can identify the top talkers via OpManager.
Outdated hardware: Outdated hardware has a severe impact on network speed. Using OpManager, you can continuously monitor hardware devices and identify hardware with high CPU and RAM utilization over extended periods and troubleshoot hardware issues that arise. With the resource utilization data, you can decide to purchase or upgrade the hardware after weighing current and future requirements.
Switching loop: A switching loop occurs when there are multiple connections between two switches in a network or when two ports in the same switch are connected. This floods the network with broadcasts and increases the time it takes to reach the destination. Using OpManager, you can monitor individual switch ports, proactively detect broadcast storms, and troubleshoot looping issues faster.
2. Poor WAN and VoIP performance
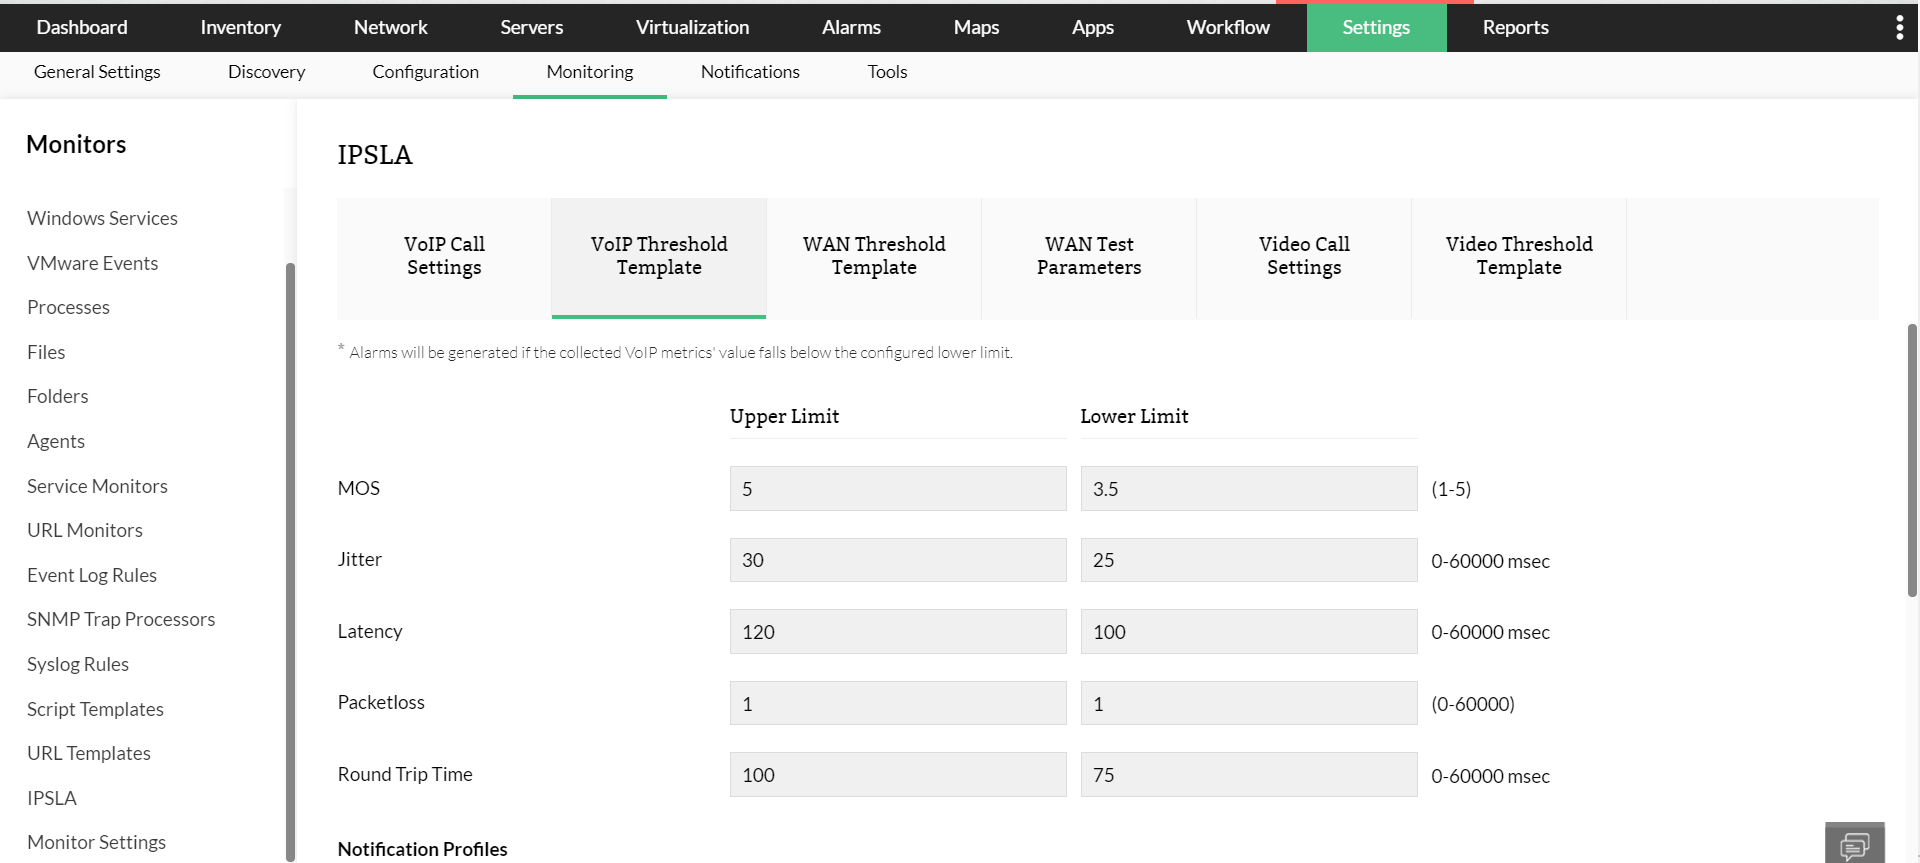
Latency: Latency is the time between a request and its corresponding response. When latency is higher, the response time for requests increases and the end-user experience is greatly affected. OpManager's WAN RTT monitor lets you configure thresholds for round trip time and instantly notifies you when a threshold is breached indicating network issues.
Jitter and packet loss: Jitter is the result of asymmetric data packet transmission. It makes audio and video calls choppy. Packet loss in a network is usually due to network congestion. One to 2.5 percent packet loss is acceptable; anything above that will result in dropped calls. Using OpManager, you can set thresholds to receive real-time alerts on jitter and packet loss issues and troubleshoot them.
Mean opinion score (MOS): The MOS is a collective measurement of call quality. It’s calculated based on parameters such as latency, jitter, and packet loss. It ranges from 1 (poor) to 5 (excellent). Using OpManager, you can set a lower limit for MOS and get alerted when the call quality drops beyond the set limit. This helps you immediately look into network congestion, troubleshoot the issue, and improve call quality.
3. Slow application or server response time
Slow network speeds and poor WAN performance mostly affect the internal team, but the repercussions of slow response time for an application or application server can be disastrous. Slow response time not only impacts your revenue and reputation but also ends in legal disputes, as you might have a QoS agreement with your clients.
The common causes of slow response time are:
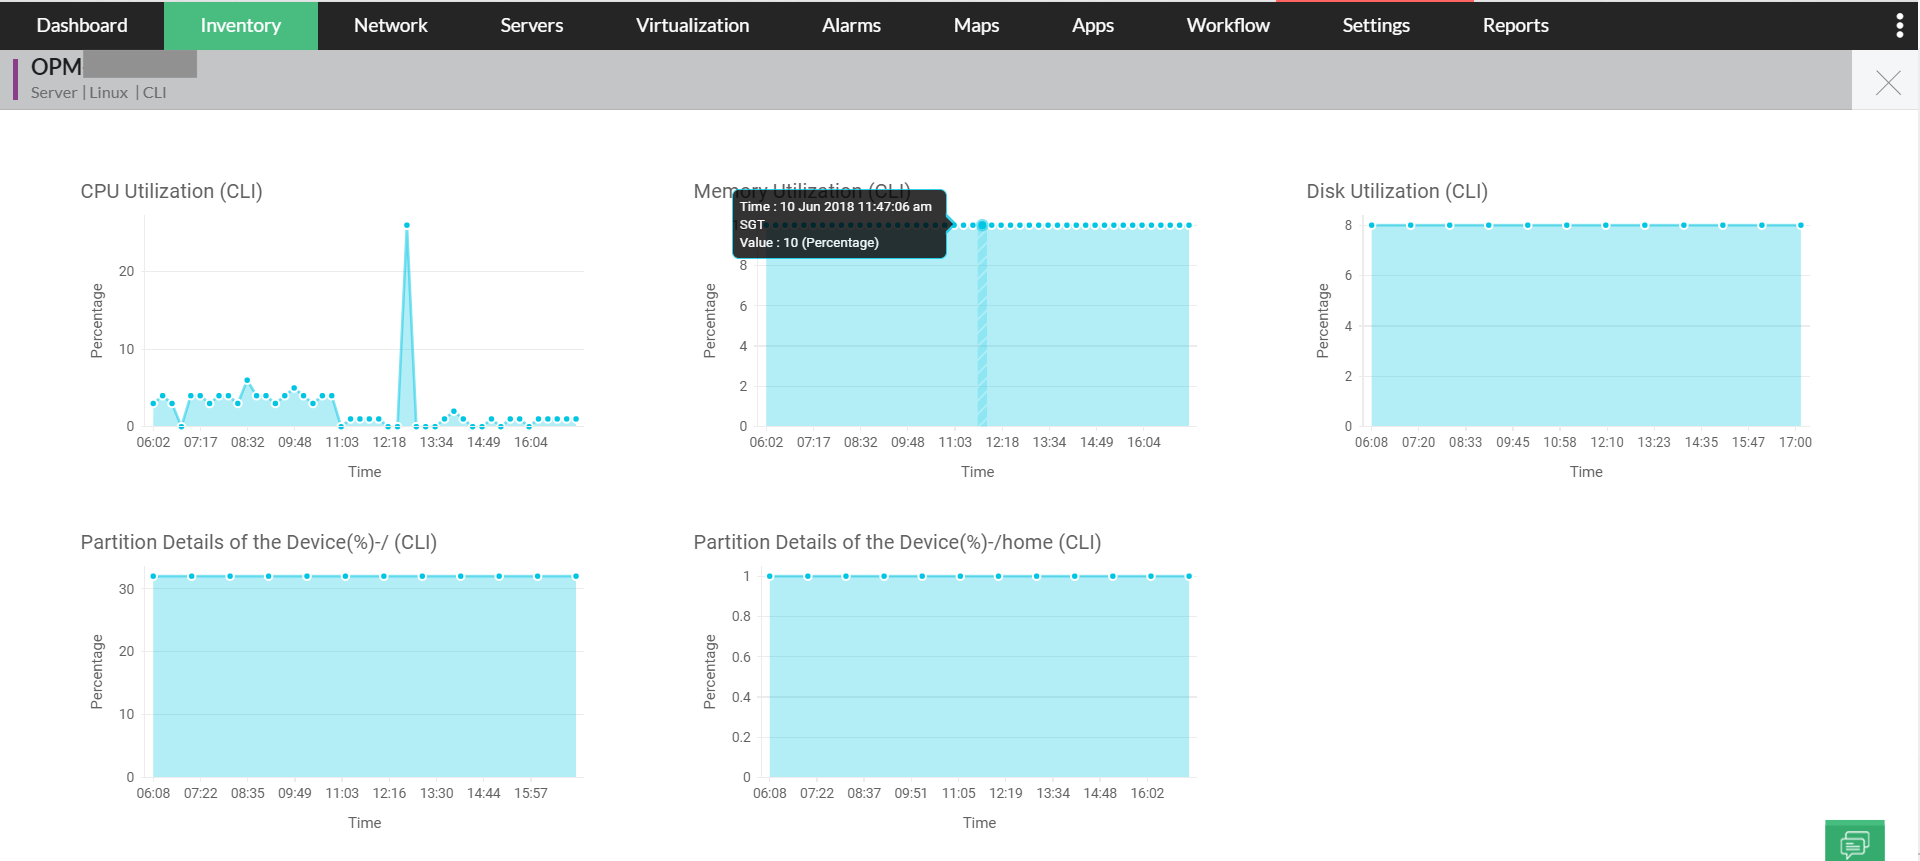
Increased server load: Increased load on your application servers might cause high CPU and RAM utilization, making the server incapable of handling all incoming requests. Naturally, the response time increases, affecting customers. Using OpManager, you can set thresholds to get instant alerts on server performance problems and troubleshoot them.
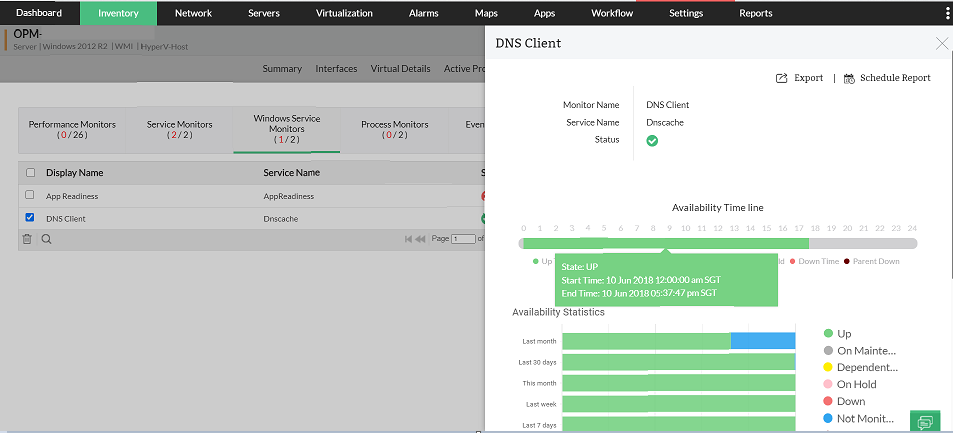
Services: Some applications or application servers require certain services to be running in the background for successful request handling. When these services are no longer available, the applications might fail to respond to requests. Using OpManager, you can monitor services that are critical for the hosted applications, and get alerted in real time when any of the services are unavailable to initiate faster troubleshooting.
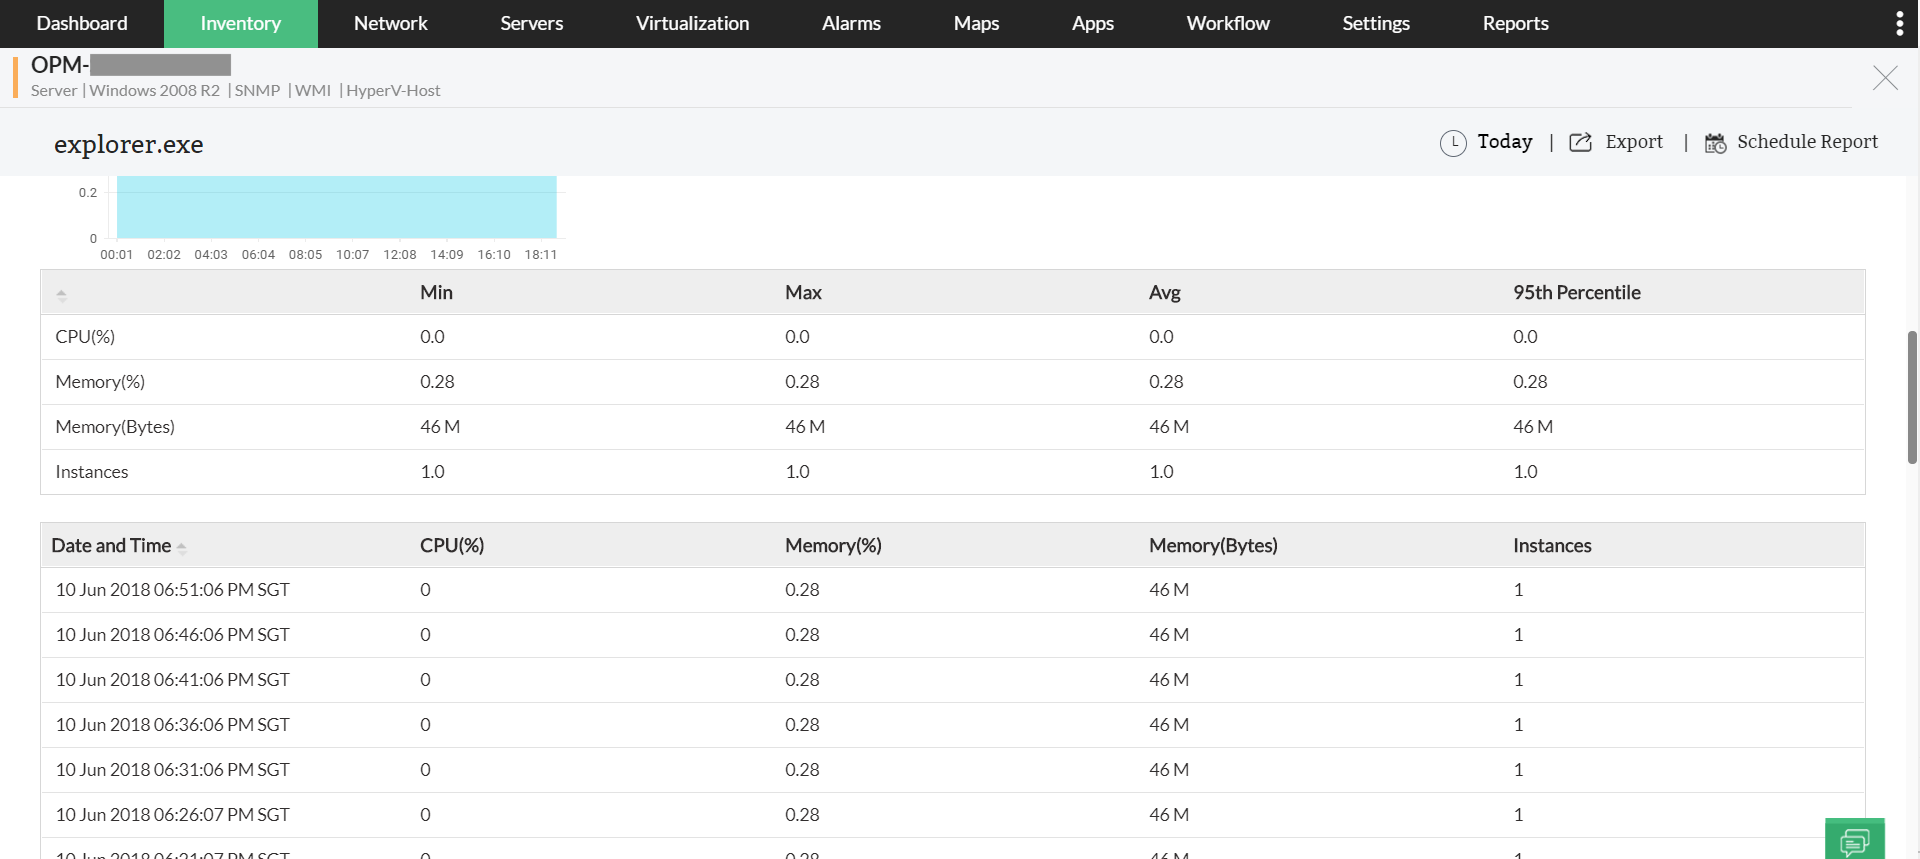
Server processes: Some processes running in the application server might consume more RAM and CPU, causing slow response time. Also, processes might be listening to important ports that applications need. This blocks the applications from listening to critical ports, causing slow response time and application failure. This network issue can be addressed with OpManager by proactively monitoring server processes. Apart from monitoring, you can also use OpManagerto remotely stop processes in any server.
4.High CPU utilization
High CPU utilization is a crucial factor for network availability. When a device runs high-end applications and require more resources for execution, there is a chance for CPU utilization to spike to support execution. In this instance, such a high CPU utilization will increase network traffic, overload server, and eventually halt the user interface.
When this happens too often, CPU performance will be impacted as the processing speed of CPU tends to deplete, and few incoming requests tend to get dropped. In other words, the common cause of high CPU utilization is increased network traffic that overloads CPU and server.
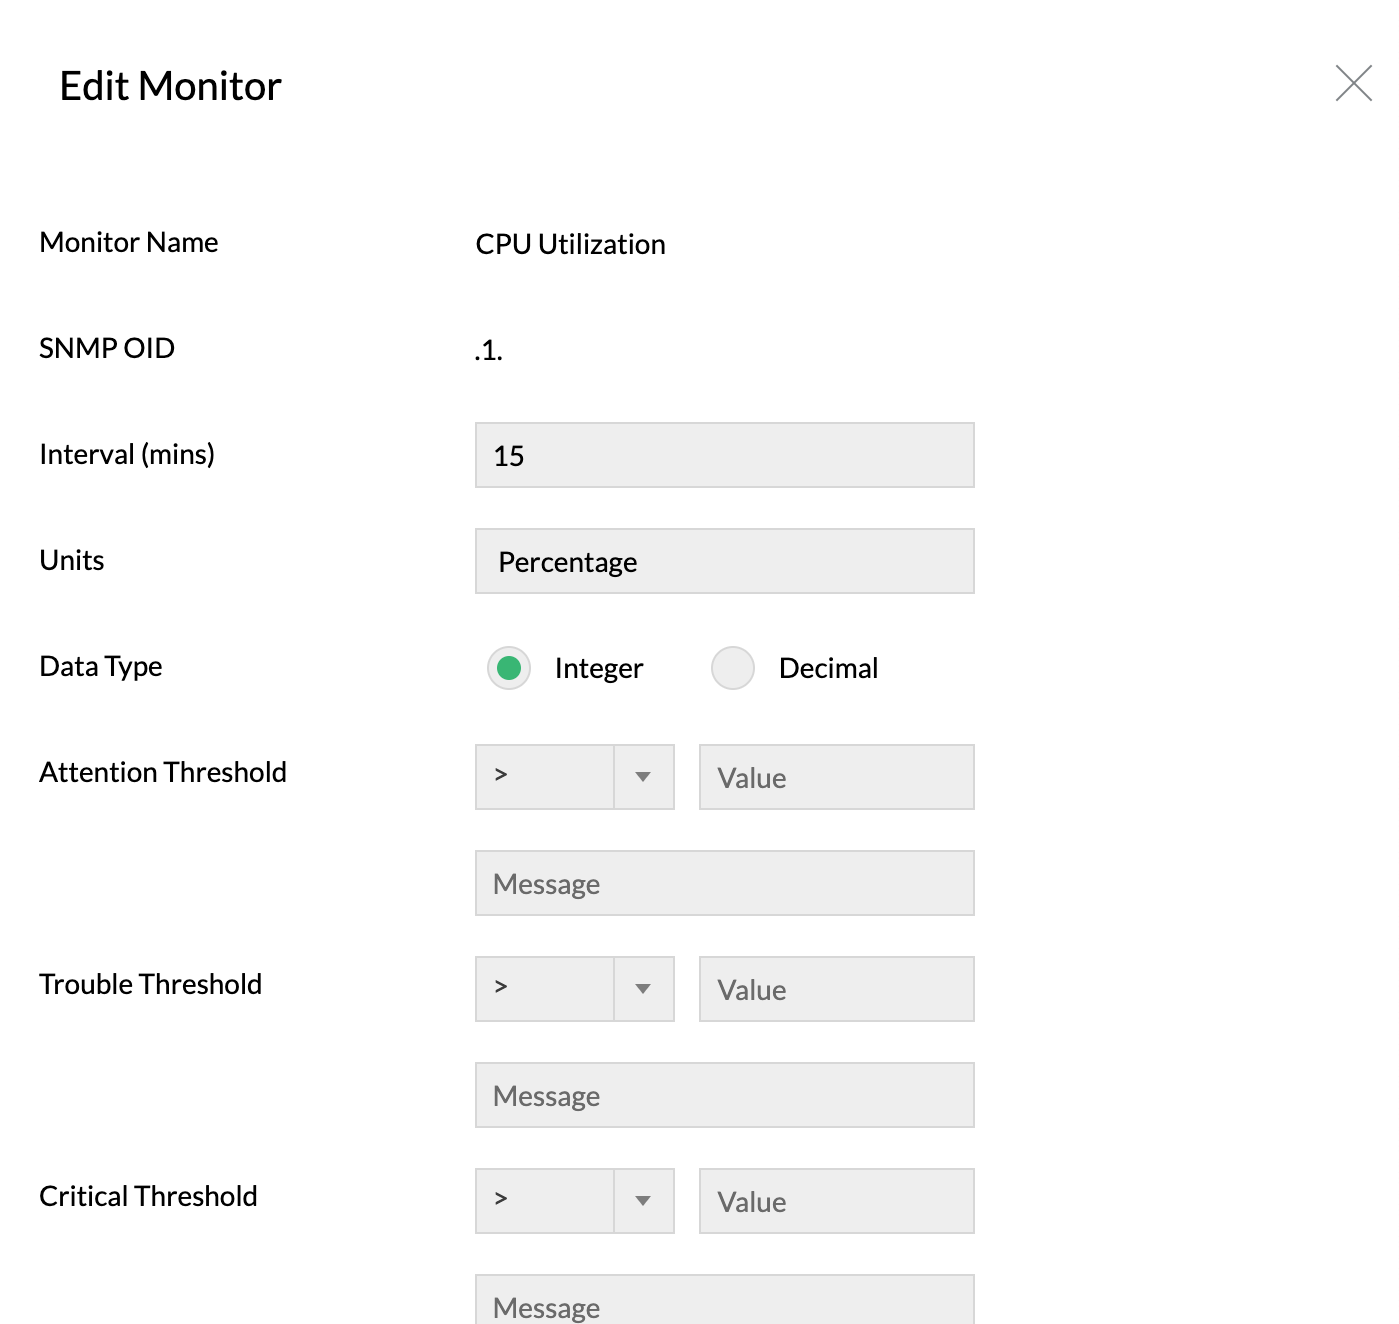
Using OpManager's CPU usage monitor, you can monitor CPU utilization and set thresholds to alert you on abnormal CPU usage limit or when the processor time reaches its level. These alerts can be sent via multiple notification channels such as SMS, email, slack, and web alarms with which you can troubleshoot CPU utilization issues at the earliest.
5.Wi-Fi issues
Wireless networks are the core part of a network that could disrupt network operations with interferences. In a network, signals from other wireless devices such as bluetooth devices, cordless phones, etc., can also interfere with WiFi signals and create poor Wi-Fi experience for the users. Few Wi-Fi issues include low signal strength, slow internet connection, slow file transfers, intermittent Wi-Fi disconnection etc., When such incidents happen, network admins need to identify the reason for the issue and fix it quickly. A Wi-Fi network test tool can help identify the root cause of the interference.
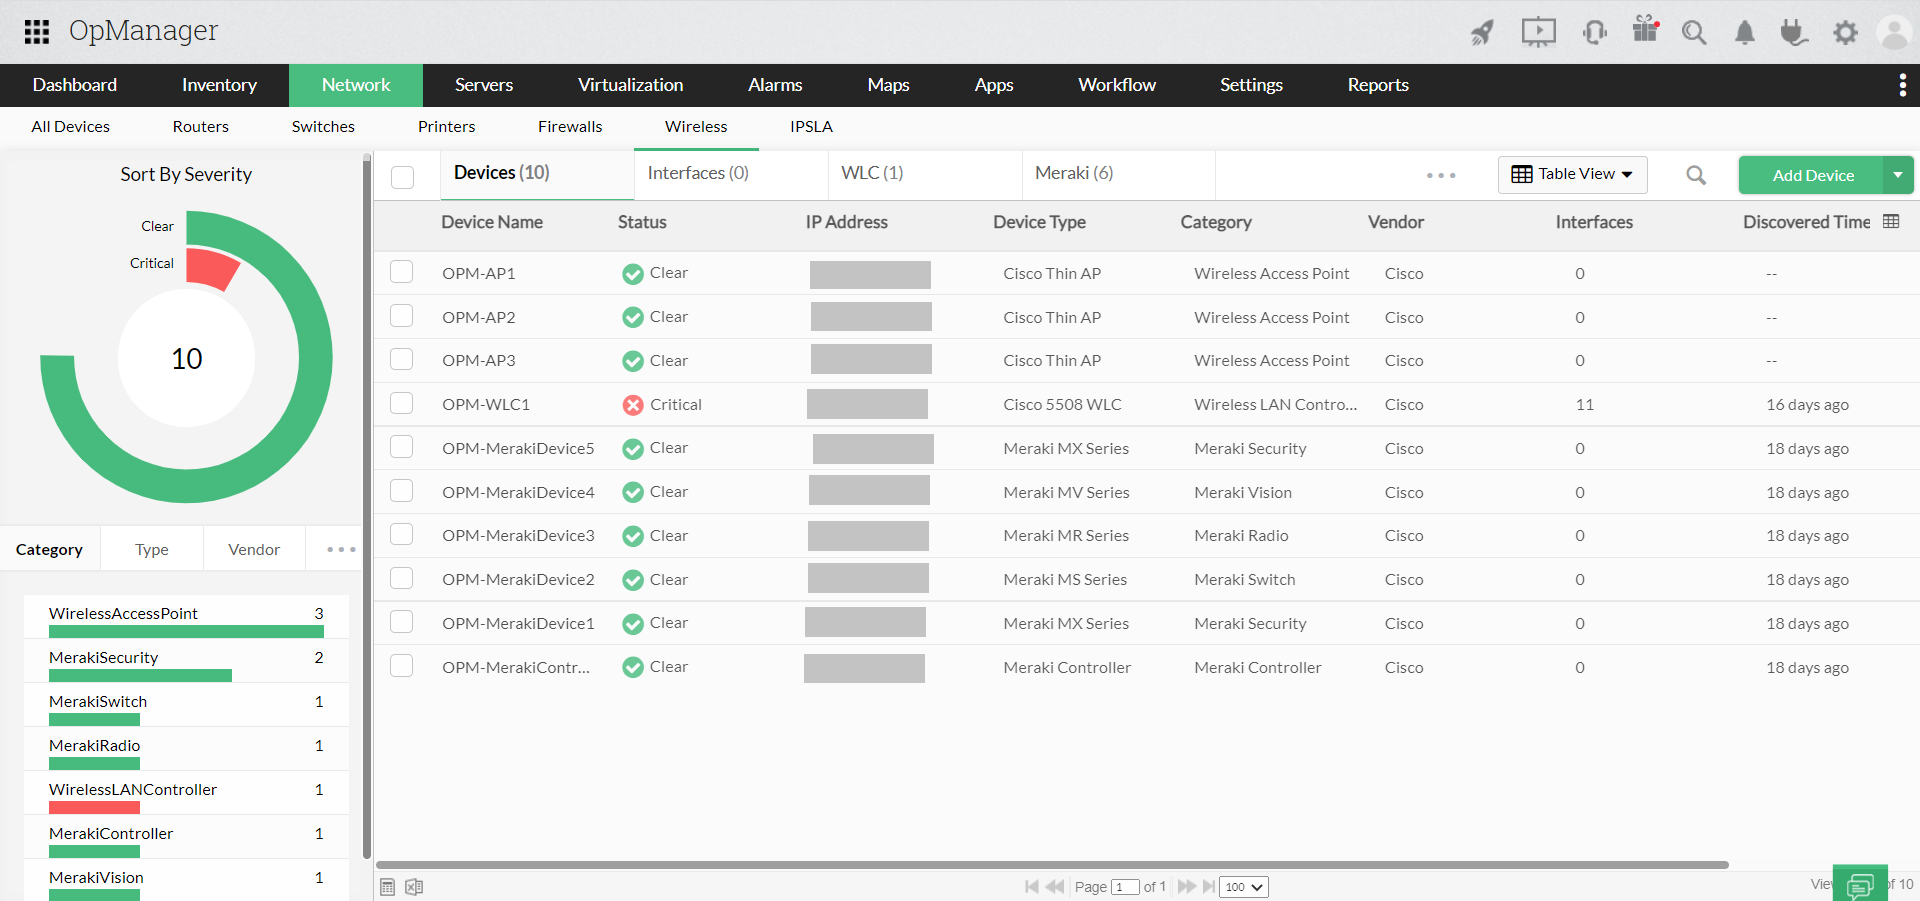
OpManager's Wi-Fi monitor enables you to track key performance metrics of your Wi-Fi environment including signal strength, resource utilization, network traffic, availability, and client count. This helps you keep the health and availability of your Wi-Fi network and its components in check by diagnosing and troubleshooting Wi-Fi issues faster.
Troubleshooting toolkits within OpManager
OpManager also has handy built-in tools for troubleshooting network issues. These network troubleshooting tools include simple command-line-based troubleshooting utilities that allow for a systematic, efficient approach to network troubleshooting. Some of these network troubleshoot tools are:
- Ping
- Traceroute
- SNMP Ping
- DNS Resolver
- DHCP Scope Monitor
- WMI Query Tool
- CLI Query Tool
- SNMP Tool
- Cisco Tools
Whether it's a critical application server issue or a harmless network blip, OpManager has got you covered.
