Cisco switch monitoring
The term switch stack refers to a combined module that consists of several network switches bridged together with the aim of delivering maximum scalability and performance.
All Cisco switch stacks consist of the following components:
- Master switch: The master switch provides all switch-related functions such as Cisco Discovery Protocol (CDP), virtual LAN (VLAN), VLAN Trunking Protocol (VTP), Spanning Tree Protocol (STP), and more. Each stack has an unique configuration file assigned to it, which is managed by the master switch. The master switch automatically configures all new switches added to the stack.
- Active switch: The active switch, or commander, handles the configuration of the entire stack. This is the primary point of contact for performance upgrades or fault detection.
- Standby switch: The standby switch acts as a backup mode of contact in the absence of the active switch.
- Stack port: A port that is used to communicate with other switches of the stack. A stack port can either be preconfigured or user-defined.
Each stack has an unique IP address that is linked to the master switch. Stacking is widely approved as the most effective, flexible, and scalable mode for increasing the capacity of a network, and it is important to perform Cisco switch monitoring for their availability and performance.
Cisco switch stack monitoring in OpManager
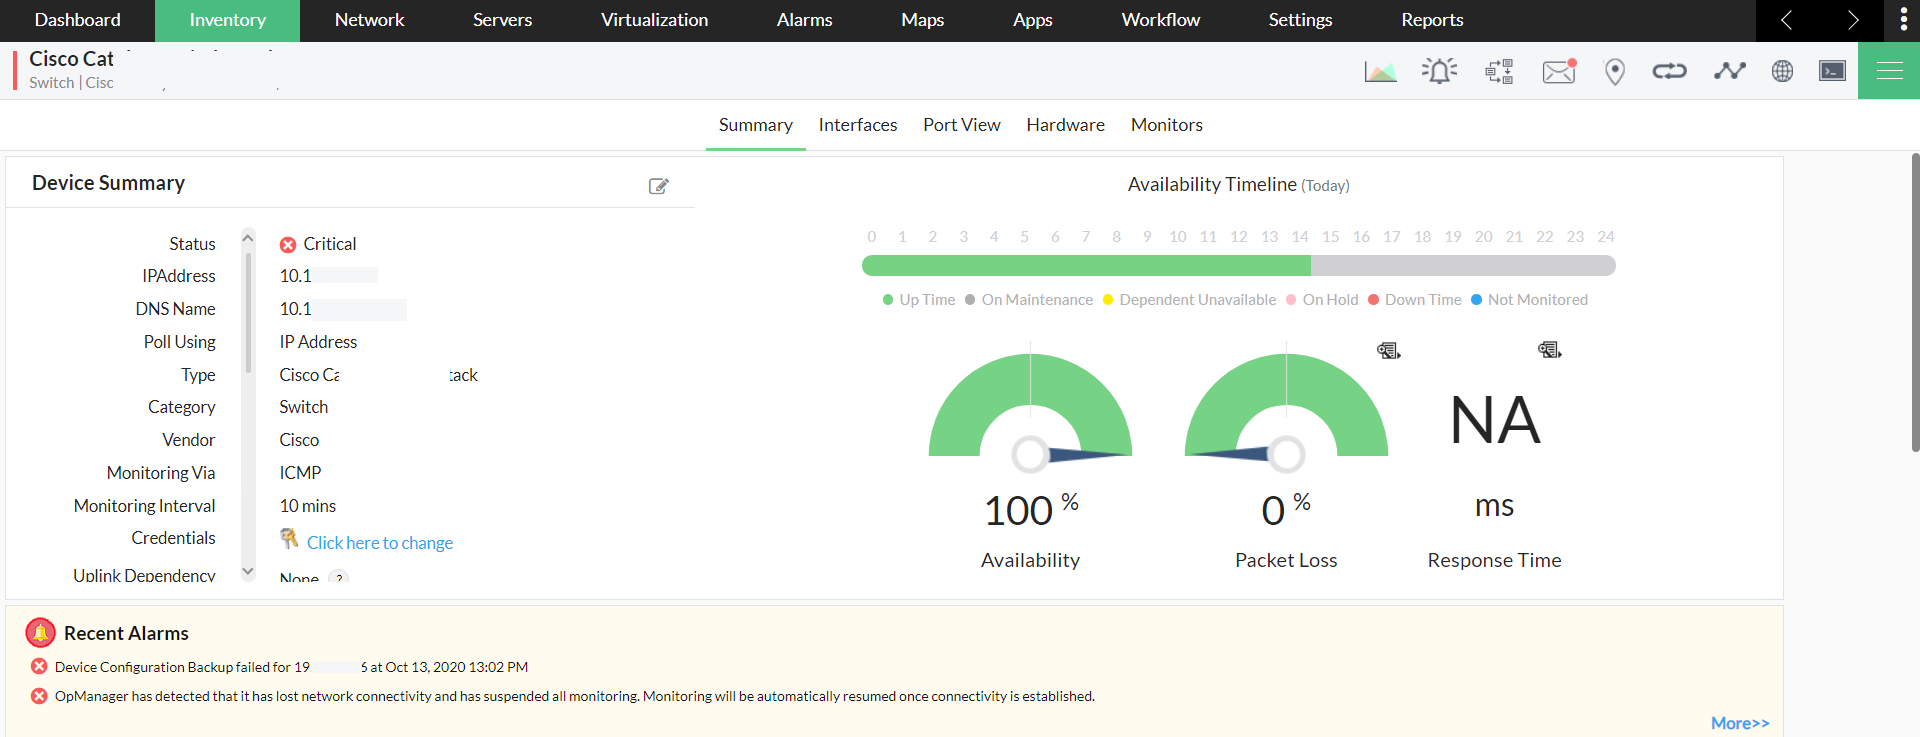
OpManager now supports Cisco switch stack monitoring for versions 125300 and above. Cisco switch monitoring tool is a combined interface with a unified SNMP/CLI view and is provided for all units in a stack that is discovered in OpManager. The device snapshot page displays the availability status of all individual switches bundled within the stack. This Cisco switch stack management feature helps you with an entire stack monitoring with complete focus on all individual switches in the stack. Switch stacks can be discovered in OpManager individually from the Add Device page or as bulk from theNetwork Discovery page.
Stack topology
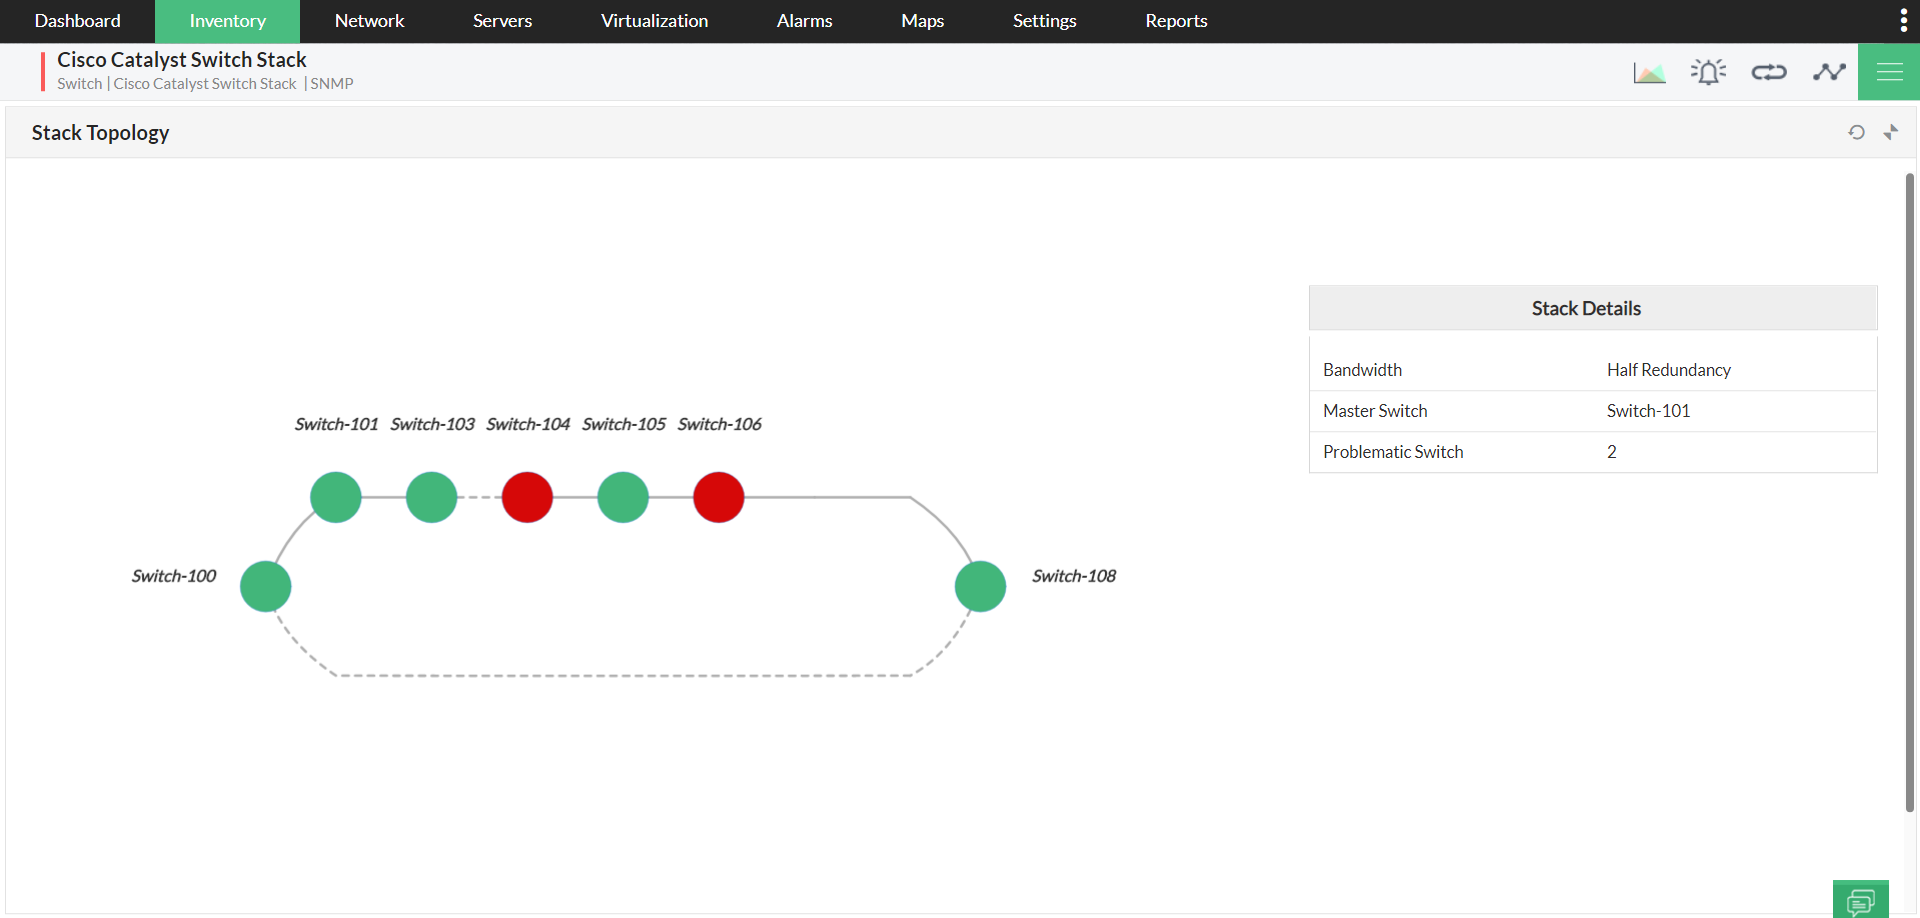
Cisco switch monitor's stack topology exhibits the graph representation of the data port connectivity between various switches in a stack along with the status of that switch. This data is fetched from the stack port information of the discovered stack. This varies from time to time based on the switch state, switch number, role, and more. OpManager's Cisco switch monitoring software makes use of this stack port information from the master switch and plots the topology map accordingly.
Stack details: The stack details table gives you information on the currently acting master switch, the bandwidth consumed by the switch stack, and the number of problematic switches in the stack.
Switch stack details
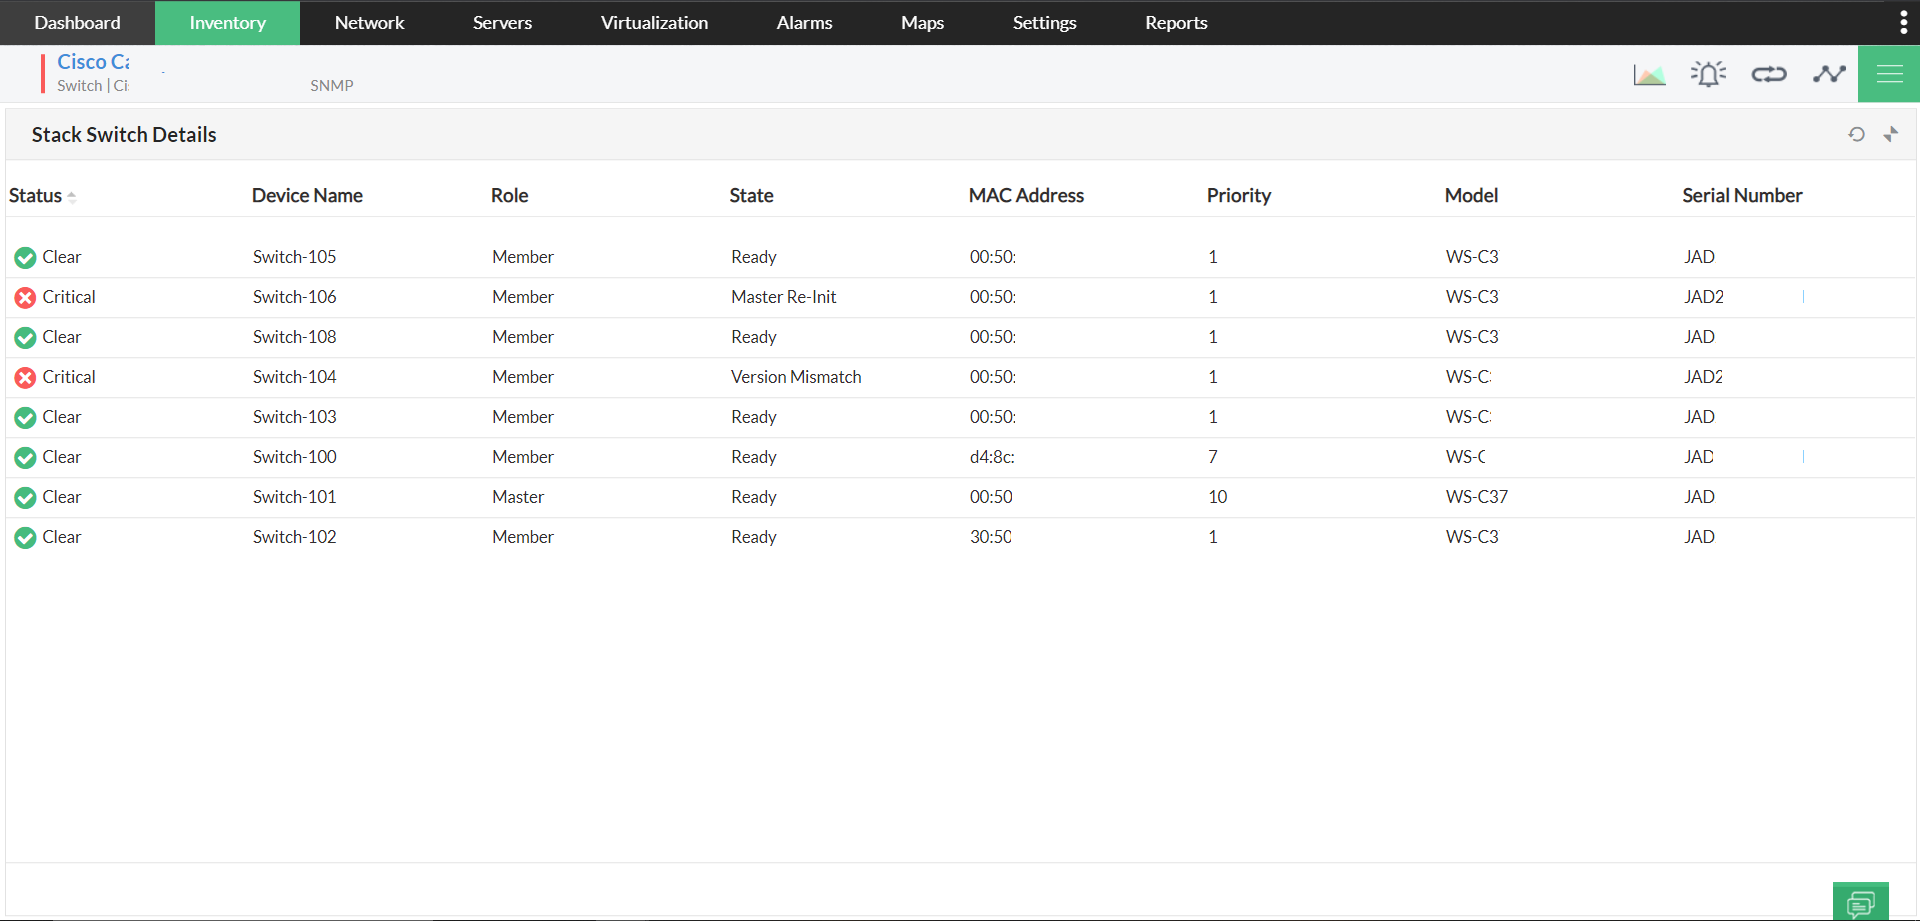
The switch stack table is similar to that of a device inventory. OpManager fetches the following inventory information automatically upon discovering a switch stack.
- Status: Refers to the change in role, state (not in ready), switch number change, and more.
- Role: The role of that particular switch (member or master).
- State: The current operating condition of that switch (ready, master re-init, version mismatch, and more).
- Priority: This is software priority used during master election. The higher the value, the higher the chance that switch becomes a master switch.
- MAC address: The MAC address of that particular switch.
- Model and serial number: The model name and serial number of that particular switch.
Stack sensor details
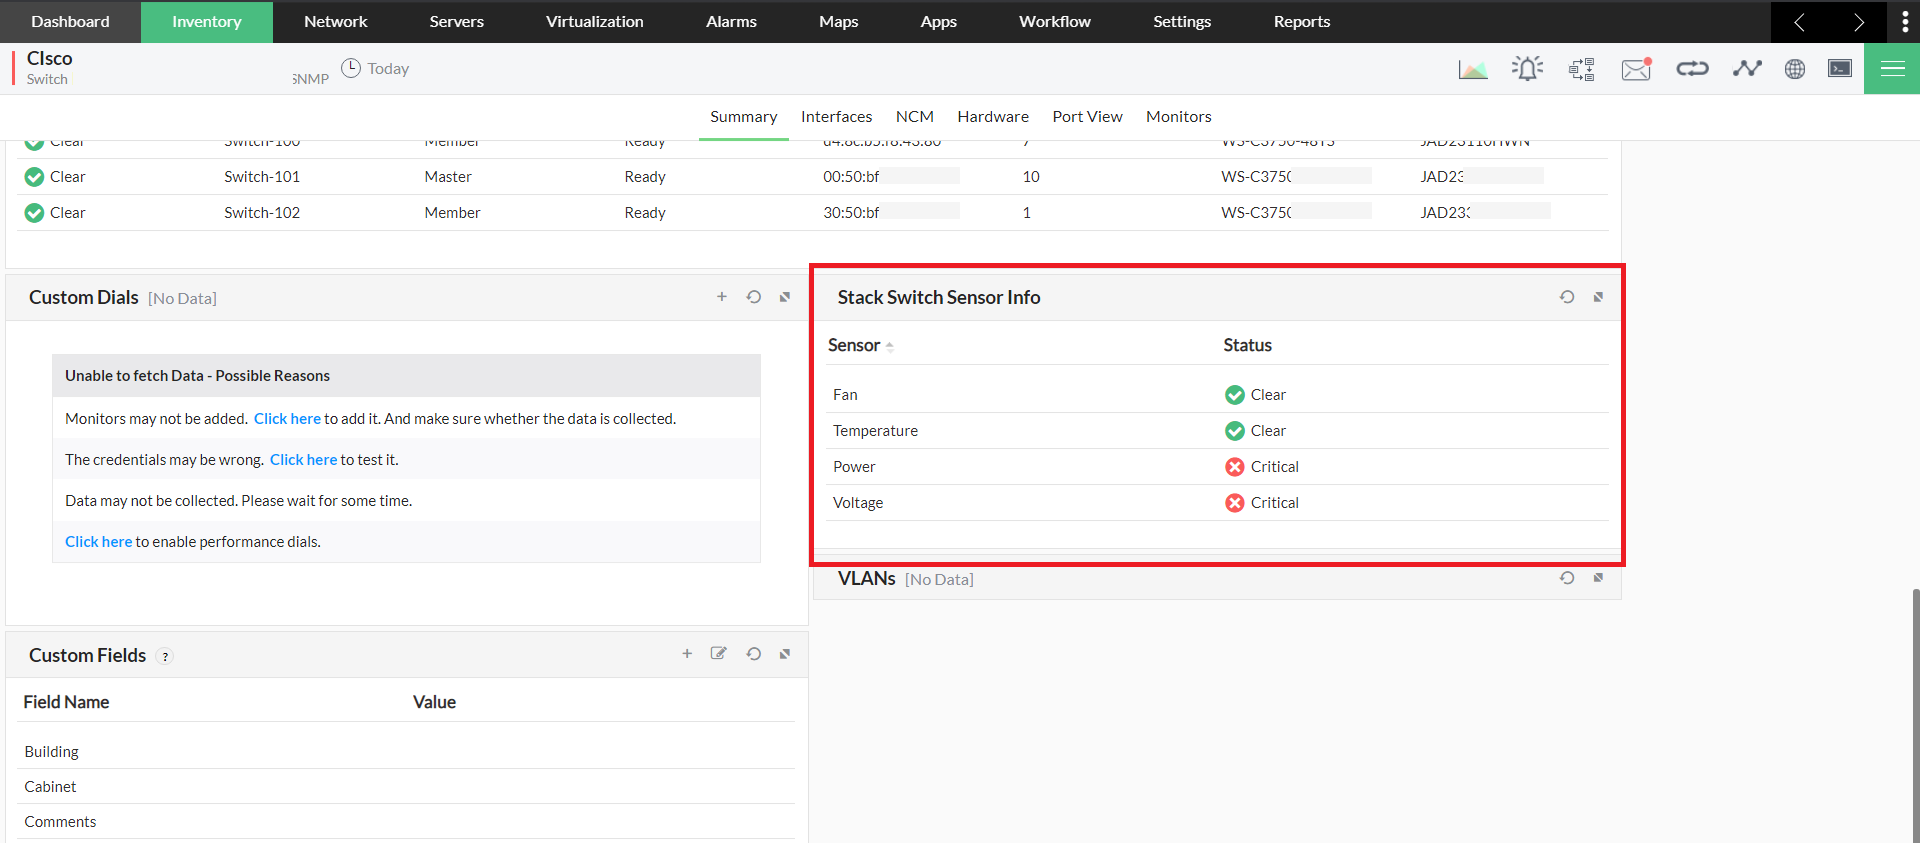
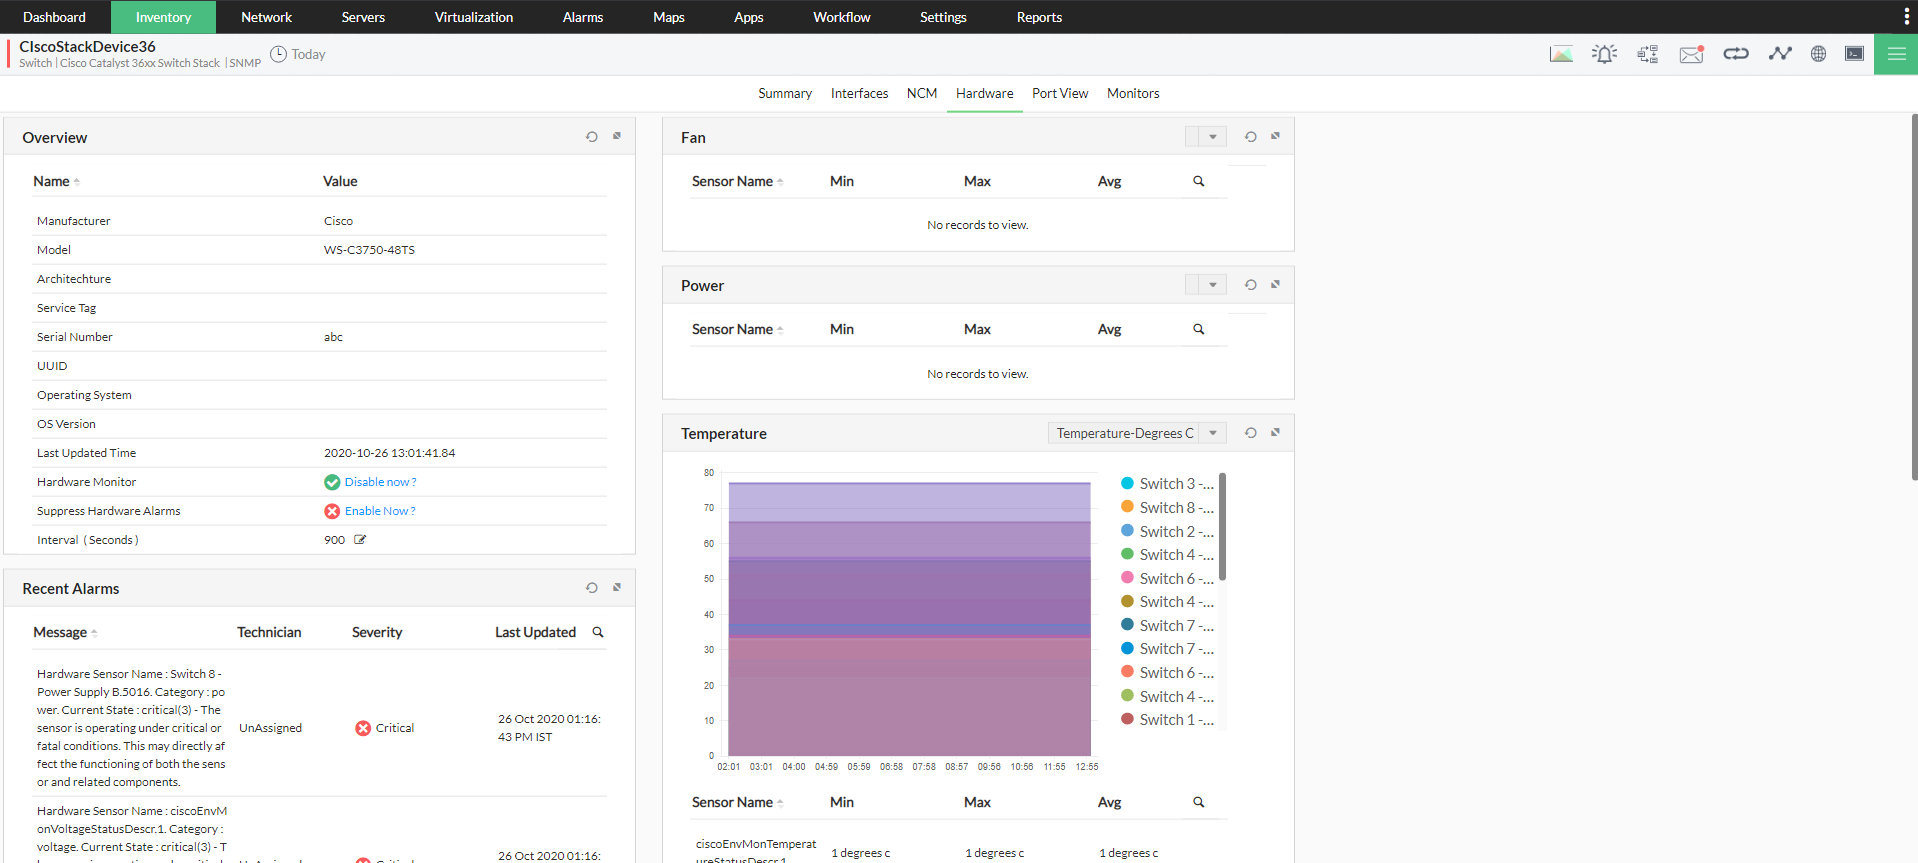
The stack sensor details widget in the stack monitor tool gives you a consolidated view on the status of all hardware sensors associated with the switch stack such as fan, power supply, temperature, and voltage sensors. This allows you to monitor cisco switches of the status of all available hardware sensors at any given time remotely. For detailed information, you can further drill down by clicking a sensor link to be redirected to the corresponding hardware monitor details page. This gives all the necessary switch-wise sensor information.
Alert generation
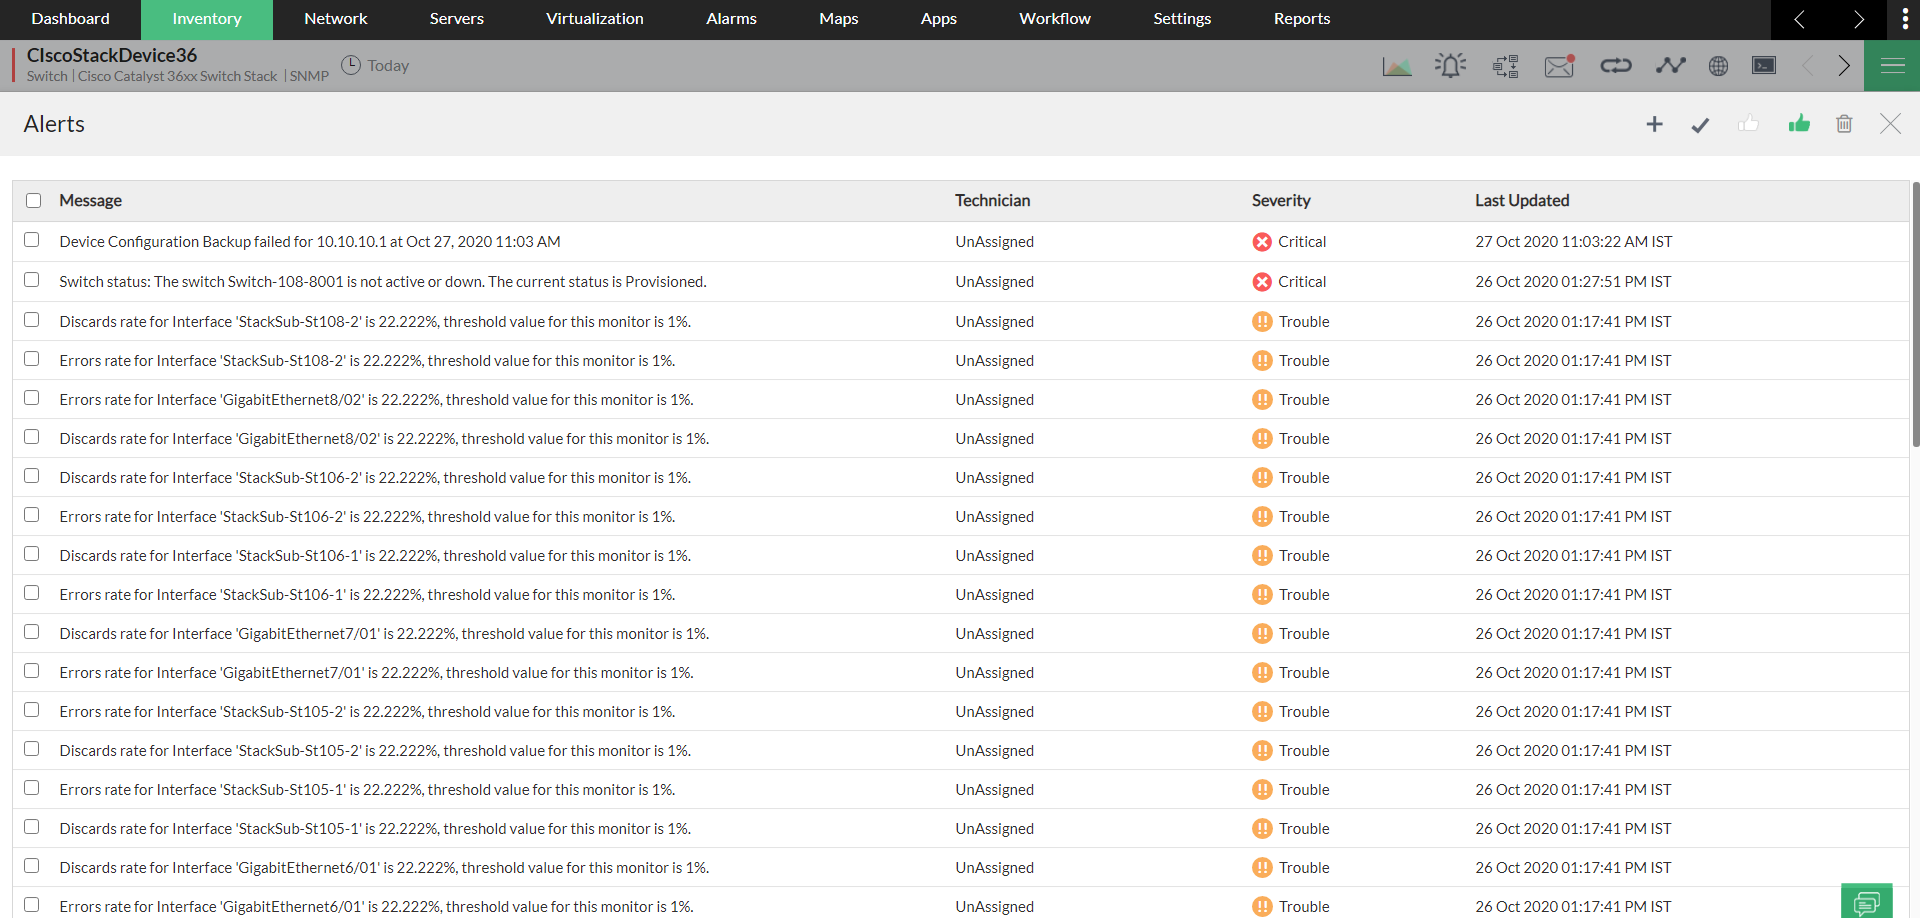
OpManager keeps network administrators informed about the changes done to all the monitored stacks in your environment. OpManager's Cisco switch performance monitoring generate alerts exclusively for switch stacks and informs the user when:
- A new member is added to the stack.
- A new master is selected.
- A member is removed.
- A member is not active and operational or is not ready.
- The switch number is changed.
- A switch is moved to StandBy mode.
In addition, OpManager's stack monitoring specific functionalities such as associating custom monitors, configuring thresholds, availability and performance report generation can also be carried out for the discovered switch stack.
Please contact our support team at support@manageengine.com for further details on Cisco switch stack monitoring in OpManager.
Need features? Let us know
Explore OpManager using our online demo, or download OpManager's free, 30-day trial here. If you want to see any additional network switch stacking monitoring features implemented in OpManager, we would love to hear from you. Share your ideas here.
FAQ
What are some of the challenges in monitoring switch stacks?
+
