Distributed Network Monitoring
Why distributed network monitoring matters
Modern organizations increasingly operate in an environment where networks span multiple locations; branch offices, datacenters, cloud infrastructure, and even customer sites. As operations expand, maintaining oversight over a sprawling infrastructure and ensuring availability presents newer challenges. In this era of hyperscale and geographic distribution, effective network monitoring is critical because performance, availability, and seamless digital presence/continuity are harder to achieve than ever before.
What is distributed network monitoring?
Distributed network monitoring refers to a system where network monitoring functions are deployed across various sites (as probes), and data is collected and aggregated at a central location. This architectural approach allows IT teams to monitor geographically dispersed network assets with a unified view. Benefits include increased visibility, more granular data collection, and the ability to troubleshoot remotely. Challenges often include centralized control, maintenance coordination, and language or locale-based issues.
Challenges in distributed network monitoring:
- Centralized control: Monitoring multiple remote sites from a central location with probe specific control to visualize performance hiccups.
- Network maintenance: It becomes a challenge for both remote and central network administrators to maintain the network and troubleshoot network issues.
- Language barrier: Viewing language specific stats across the probe site and central for administrators based in different locales.
How OpManager simplifies Multi-site/ Distributed Network Monitoring:
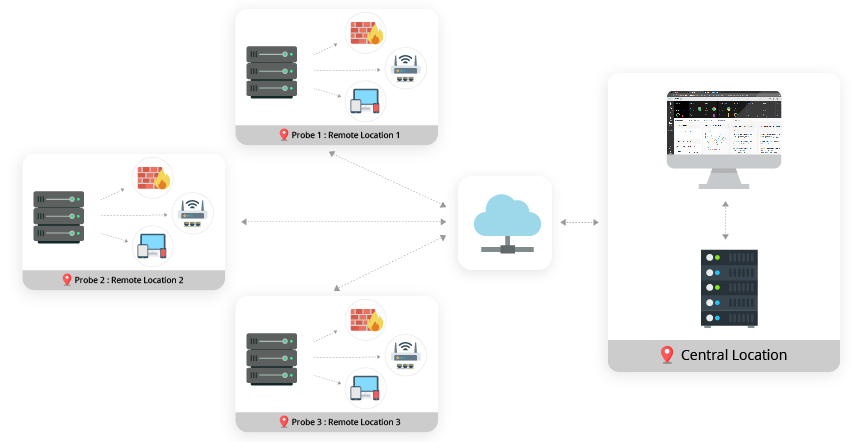
OpManager, a distributed network monitoring software, implements a sturdy Probe–Central architecture which makes it possible to scale as and when an enterprise grows and expands, without compromising on the reliability. Also with the enhanced Smart Upgrade feature, the upgrade process for your enterprise edition becomes very simple and efficient. The probes are set up at the remote network monitoring sites and the central server is designed to provide the required network visibility across locations, report network health and performance stats over multiple remote probes.Thus, distributed network management is made easy with a potent distributed monitoring solution, OpManager.
Intuitive Central dashboard:
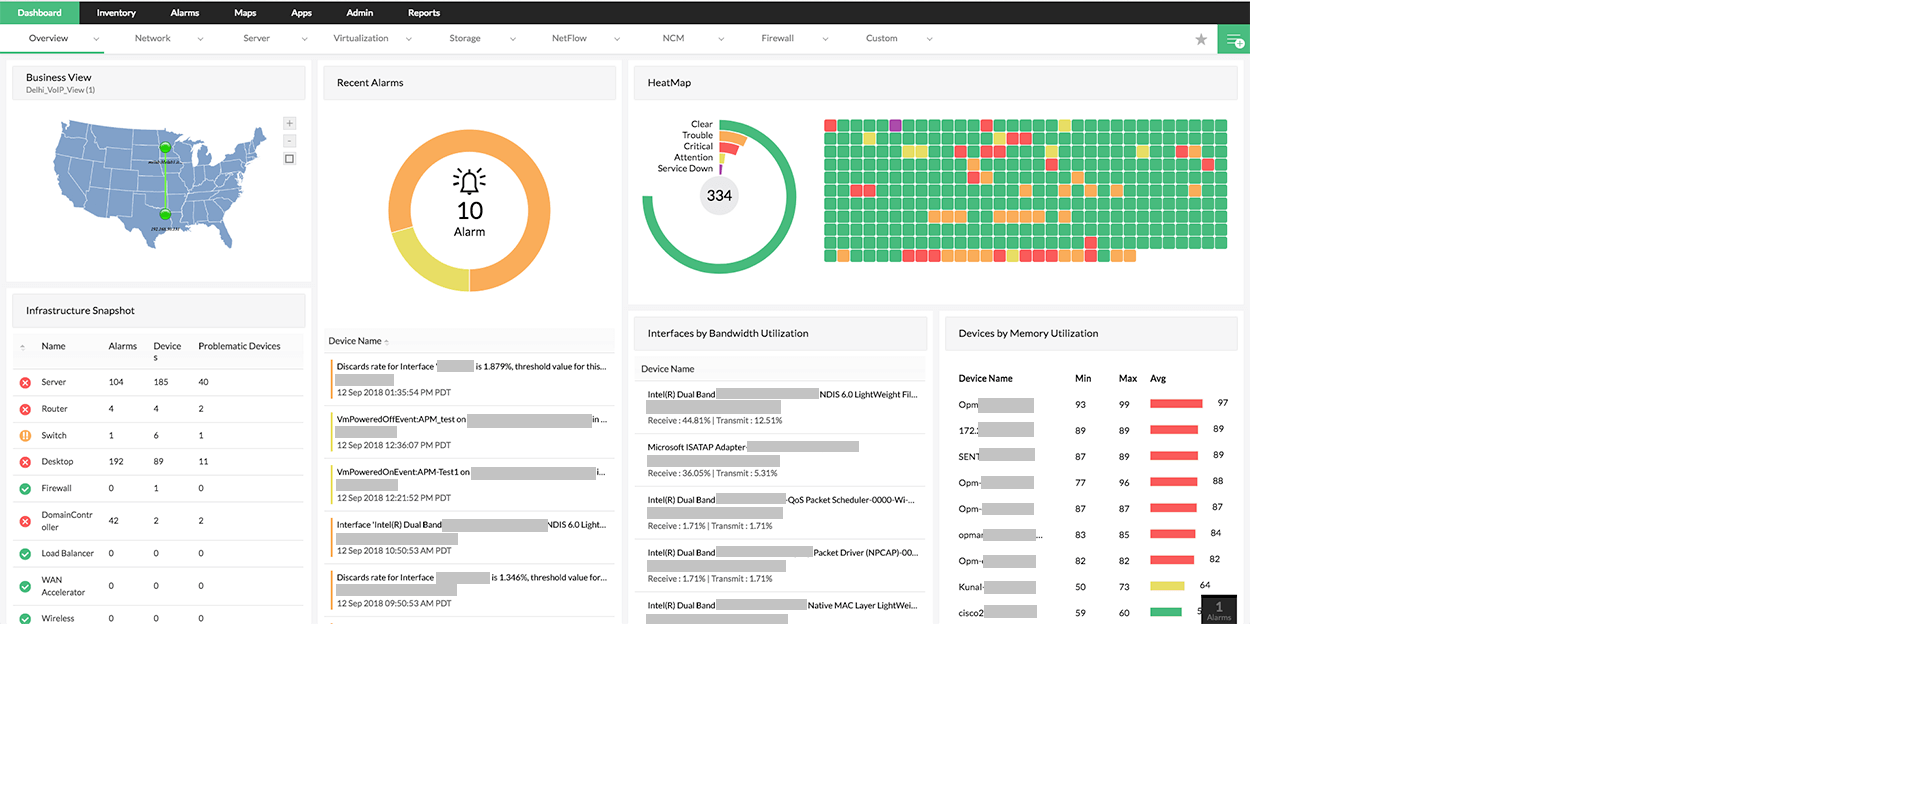
OpManager's network monitor comes with a central server dashboard that enables centralized enterprise network monitoring by giving an overall network health & performance data across the probes. This helps to visualize performance hiccups across the complete IT infrastructure and also for a specific remote site.
.
Monitoring at scale:
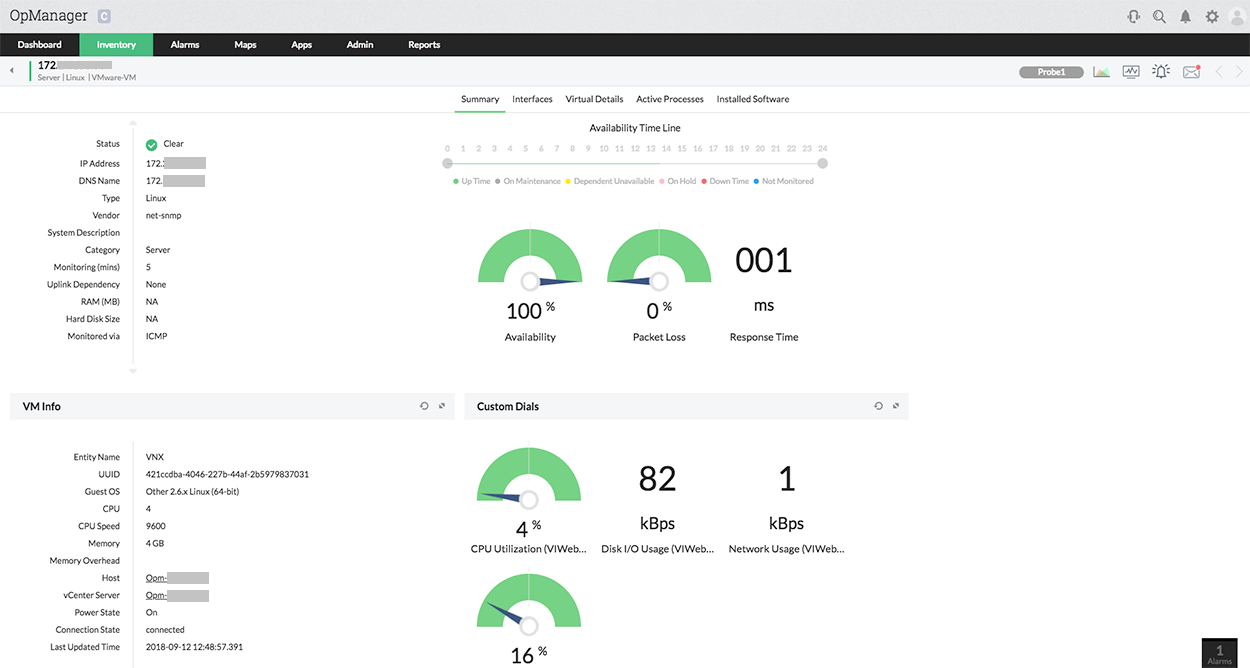
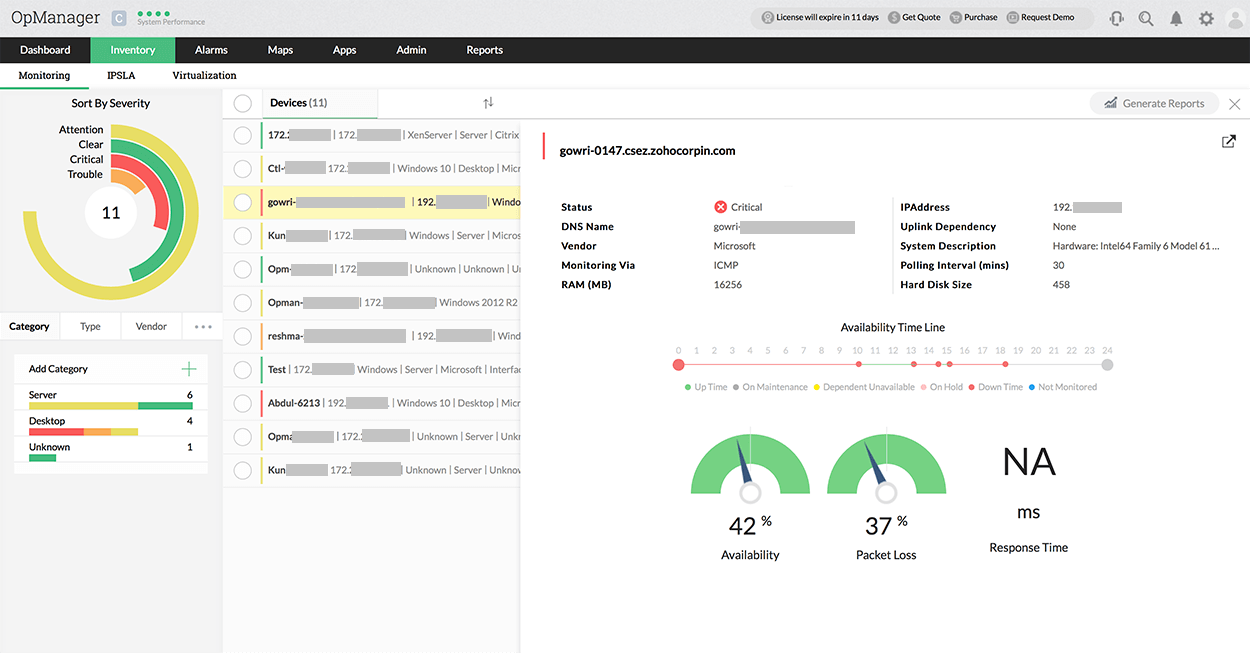
With OpManager's distributed monitoring system, you can now view the snapshot page of a device that belongs to a probe from the central server web client itself. Monitor critical performance metrics like availability, CPU, disk space, and memory utilization of specific probes.
Comprehensive Probe view:
The Probe deployed at each site performs all the network–scaling tasks such as discovery, mapping, and fault monitoring and communicates with the central server located at the Operating Center/ NOC/ Datacenter.

Probe specific language control:
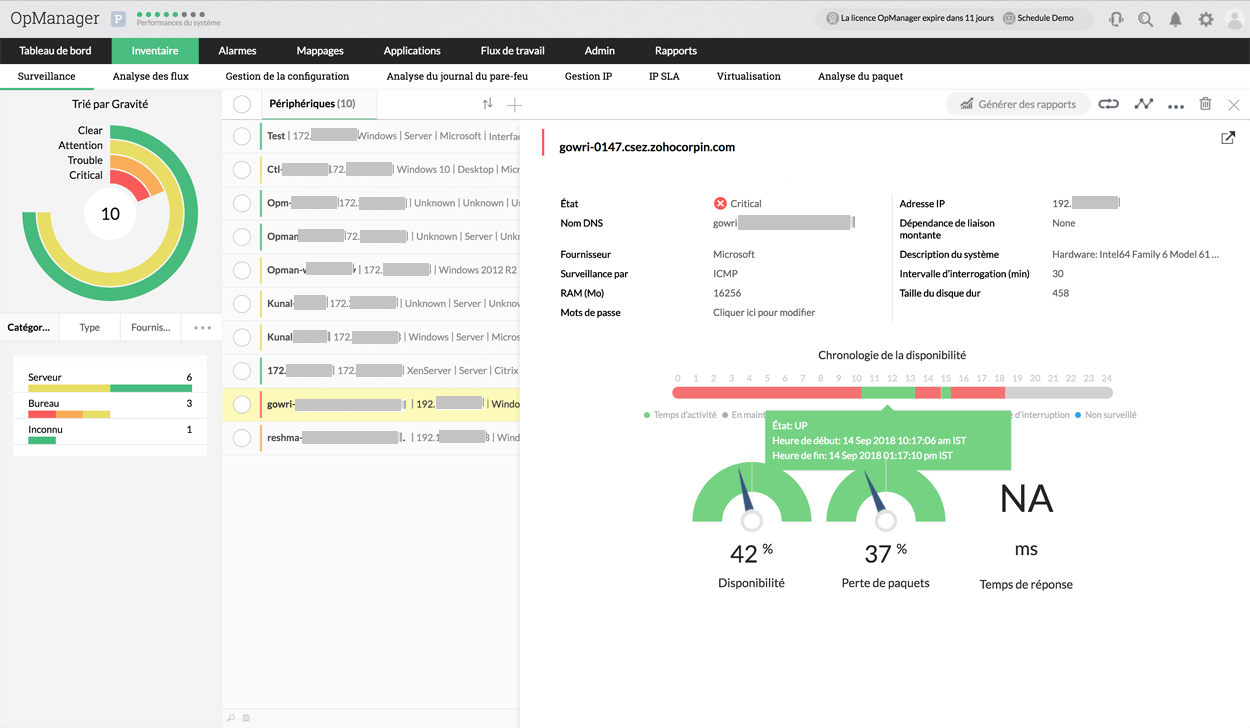
With OpManager's distributed network monitoring, you can easily overcome language barriers by viewing the stats across Probe and Central in your preferred language.
Language can be changed specific to the probe or central without compromising on network stats.
OpManager's distributed monitoring applied across real operational scenarios
- Multi-site enterprises: Organizations with national or global presence often maintain dozens to hundreds of branch offices. Distributed monitoring enables centralized oversight of network health and performance at each location, making it easier to troubleshoot WAN links, branch firewalls, and site-specific issues without dispatching staff.
- Cloud and hybrid environments: As enterprises migrate applications and workloads to public or private clouds, IT teams need unified visibility across on-premises datacenters, cloud infrastructure, and interconnecting networks. Distributed monitoring can provide real-time insights into the performance and availability of resources hosted in cloud providers (such as AWS/Azure/Google Cloud) alongside on-prem systems.
- IoT and edge deployments: Manufacturing, utilities, retail, and healthcare sectors commonly deploy IoT sensors and devices in remote or difficult-to-reach locations. A distributed architecture ensures that even these edge sites— factories, substations, remote clinics—are connected to central monitoring, helping prevent data loss, ensure device health, and respond quickly to outages or anomalies.
- Managed Service Providers (MSPs): MSPs use distributed network monitoring to serve multiple clients at once. Each customer can have a dedicated monitoring probe, while the MSP’s central operations team tracks metrics and events across all client networks from a single dashboard, enabling rapid response and reporting tailored to each customer’s requirements.
- Highly available systems and disaster recovery sites: Businesses with strict uptime requirements often deploy backup data centers or disaster recovery systems in different regions. Distributed monitoring guarantees these secondary sites are held to the same standard as primary locations and that failovers or replication processes remain healthy and synchronized.
- Post-merger and acquisition integration: When organizations merge, integrating disparate network architectures is a common challenge. Distributed monitoring accelerates this process by quickly bringing new sites and network segments under a unified management umbrella. This minimizes blind spots and ensures business continuity during network consolidation.
- Regulatory compliance and auditing: Some industries (such as finance, healthcare, and government) require granular, auditable monitoring of distributed assets for compliance. Using probes at each site allows for the collection of detailed logs and performance metrics—ensuring local requirements are met while still reporting to a central authority.
Strategic value delivered by OpManager's distributed network monitoring
Centralized updates and configuration
Managing dozens or hundreds of remote sites can be labor-intensive if each location requires separate updates, patches, or configuration changes. With OpManager, any policy, configuration, or update applied at the central server is automatically propagated to all connected probes. This streamlines IT workflows, reduces the risk of configuration drift, and keeps the entire distributed environment consistent. As a result, enterprises spend less time on repetitive administrative tasks and can focus more on strategic initiatives.
Reduced application maintenance cost
Intelligent probe upgrades initiated from the central management console reduce the overhead associated with maintaining distributed infrastructure. There’s no need to send IT staff onsite or coordinate manual updates, which saves both time and travel costs. Over time, these efficiencies add up, freeing up IT budgets for innovation and minimizing disruptions caused by out-of-date software or inconsistent probe configurations.
Remote monitoring and management
By enabling central teams to monitor, troubleshoot, and manage remote sites without onsite intervention, OpManager greatly improves responsiveness and operational agility. Problems can be detected and addressed proactively, and trends across multiple locations can be correlated to catch broader issues early. For enterprises operating across different time zones or geographies, this capability ensures continuous oversight and rapid incident response, regardless of physical location.
Language barrier elimination with probe-based customization
Multinational organizations often have IT staff in various countries, each with language preferences. OpManager allows probes and dashboards to be localized per site, so local administrators see network stats and alerts in their native language- while global teams still get unified, accurate data. This not only makes operations smoother and more inclusive but also reduces misunderstanding or error, which is crucial when reacting to real-time network incidents.
Flexible, shared licensing model
Traditional solutions often tie probe licenses to specific locations, which can create inflexibility and extra cost as the network expands or reorganizes. OpManager’s model allows license sharing across multiple remote sites, giving enterprises the freedom to scale, restructure, or migrate sites without renegotiating licenses. This flexibility ultimately lowers total cost of ownership and future-proofs the monitoring infrastructure against growth and change.
