Switch monitoring with OpManager
- Monitor CPU, memory, and health for single switches and stacks
- Track temperature, fan speed, and power supply status
- Map every device to its physical port with switch port mapping
What is switch monitoring?
Switch monitoring is the practice of tracking the health and connectivity of network switches. As businesses scale and embrace hybrid work, switches handle more load. This means that switch issues can have far-reaching effects. ManageEngine OpManager is a network monitoring software with powerful switch monitoring capabilities. With OpManager, IT teams can detect switch issues proactively and prevent unplanned outages.
OpManager's switch monitoring capabilities
Get instant health insights into your network switches
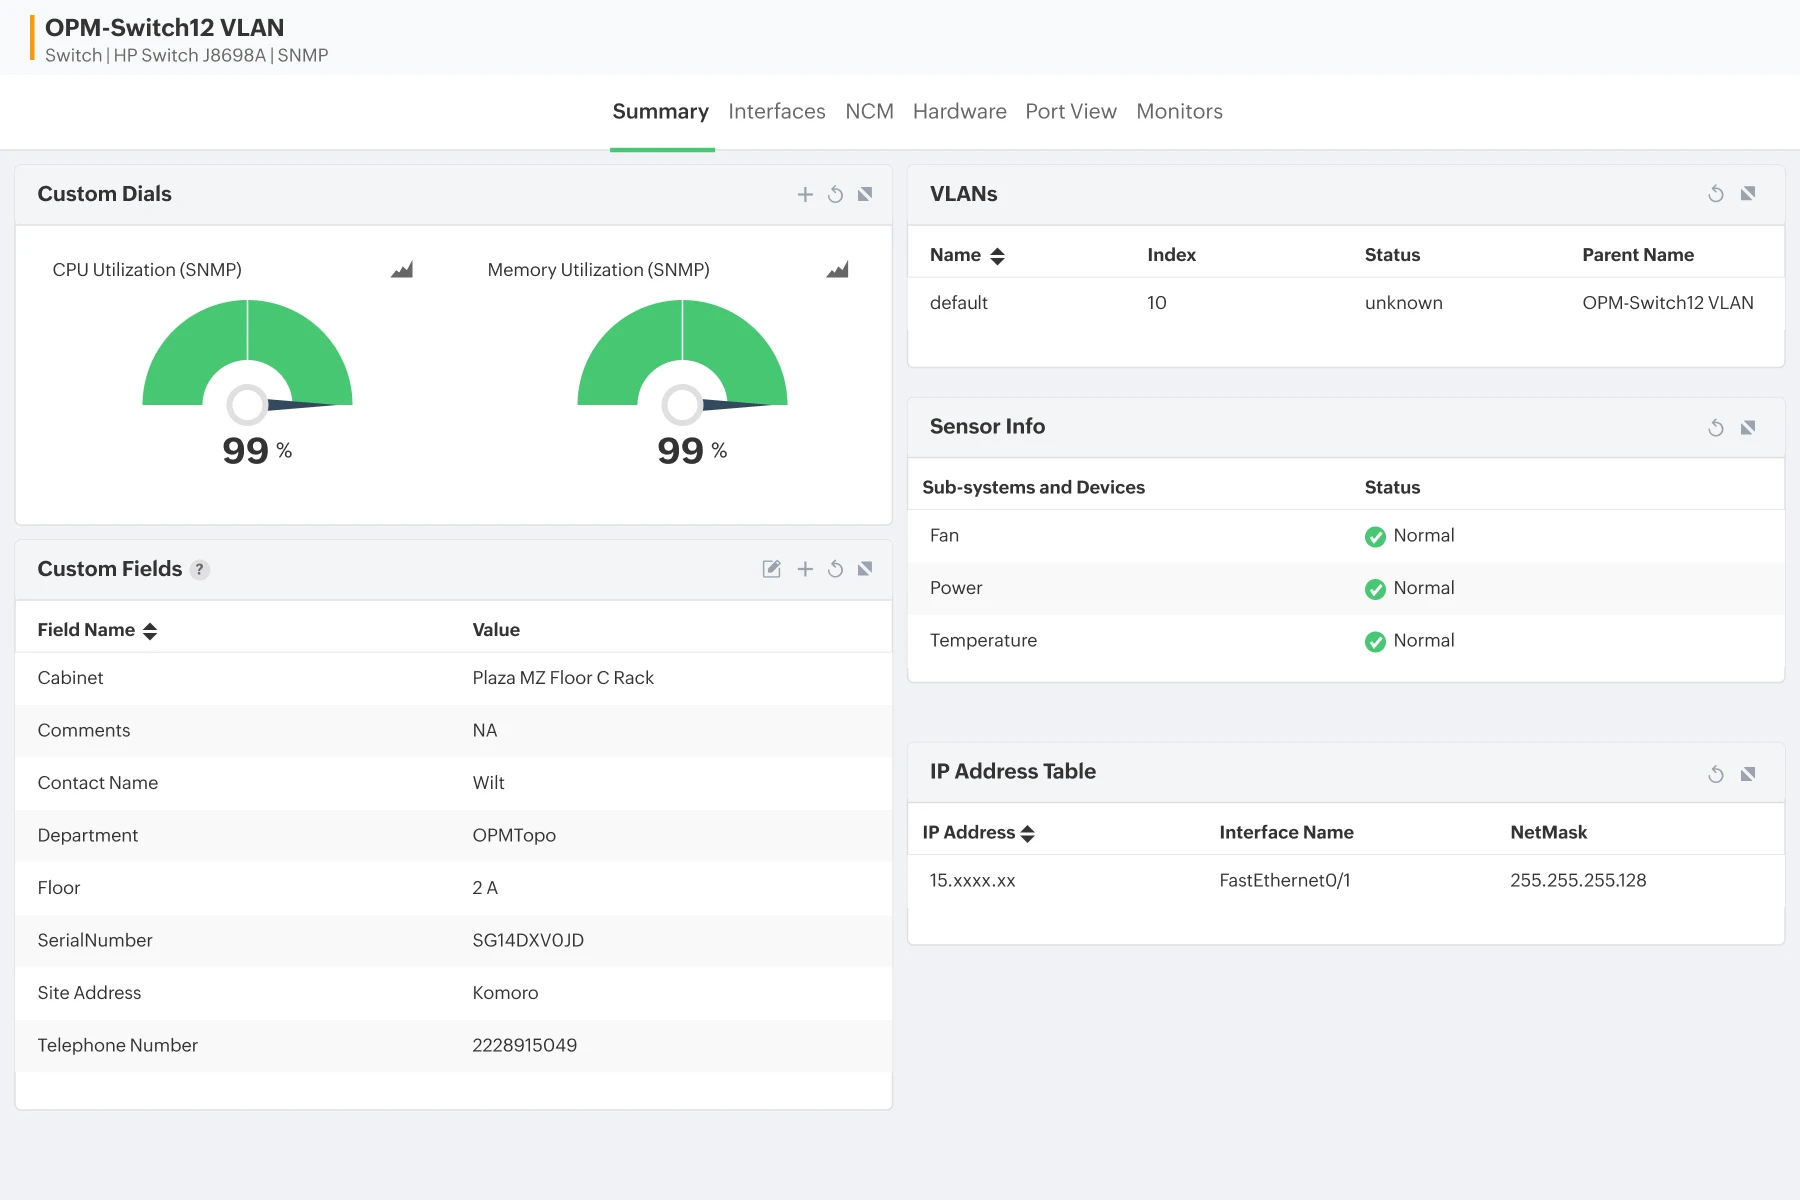
- OpManager helps you identify your switch's availability drops and performance degradations with real-time views of response time, latency, and packet loss.
- Monitor the health and performance of your network switches by tracking the CPU and memory.
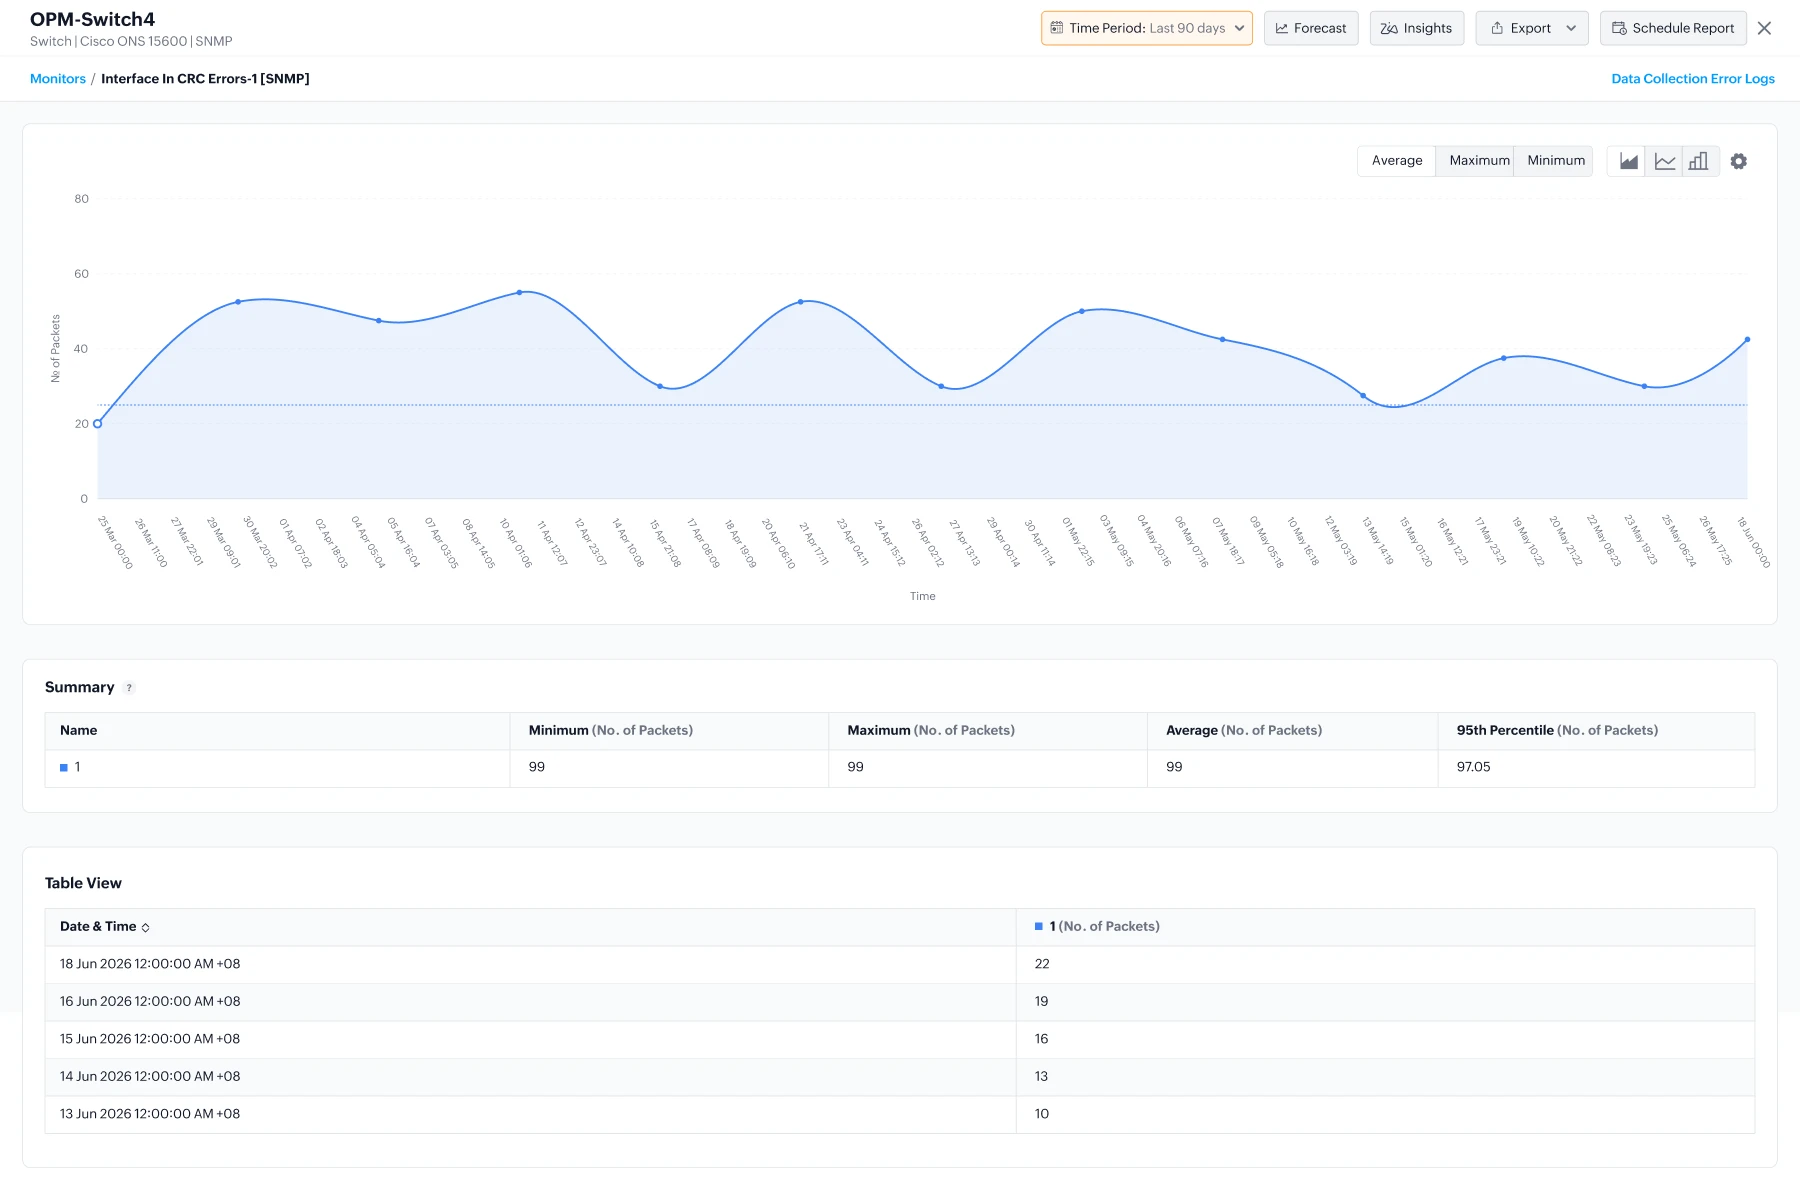
- Identify switch-level issues like CRC errors or duplex-related symptoms.
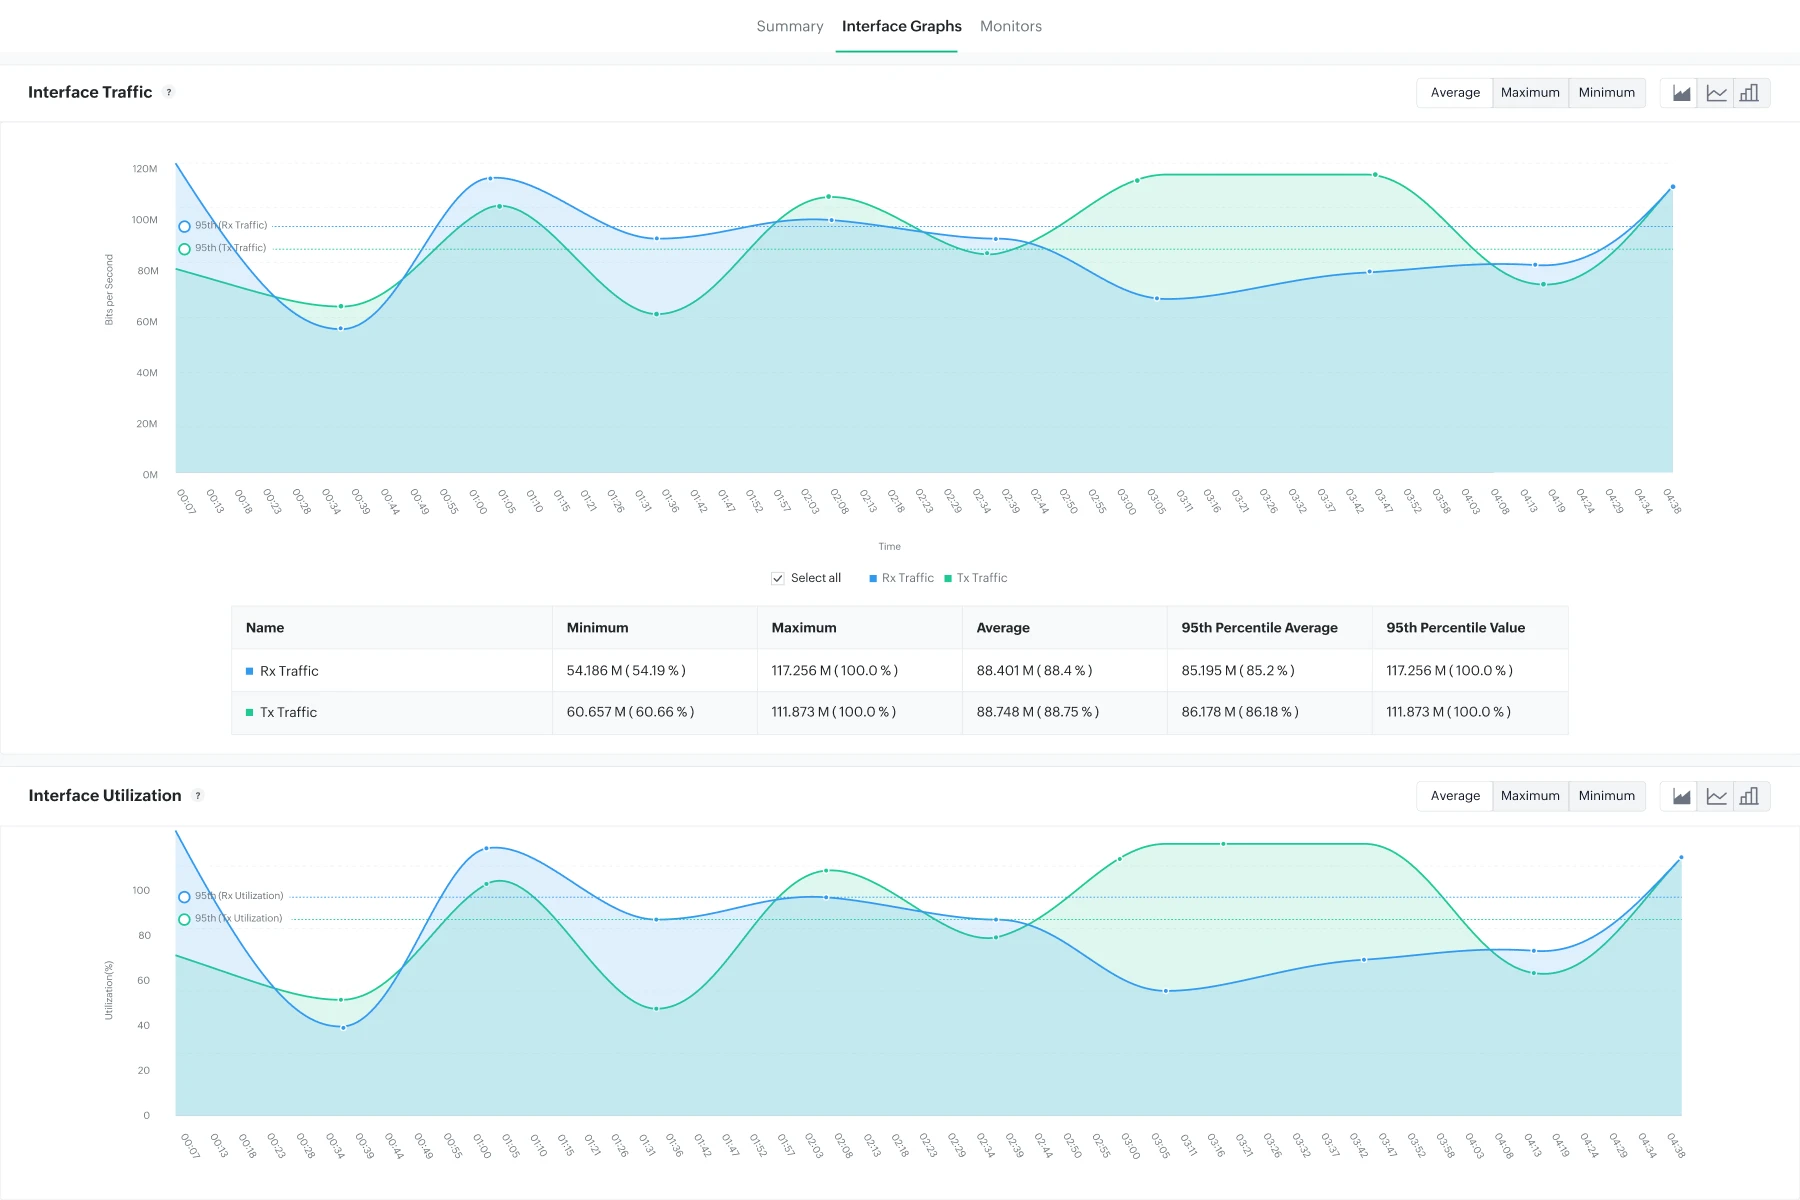
Unlock traffic insights with interface monitoring
- OpManager helps you catch interface overutilization by monitoring interface traffic, errors, packets, and discards.
- Visualize Rx/Tx traffic trends across all interfaces, instantly exposing congestion, chatty devices, or bandwidth saturation.
- OpManager's ML driven utilization forecasts also helps you anticipate bandwidth growth, justify capacity expansions, and balance traffic across interfaces.
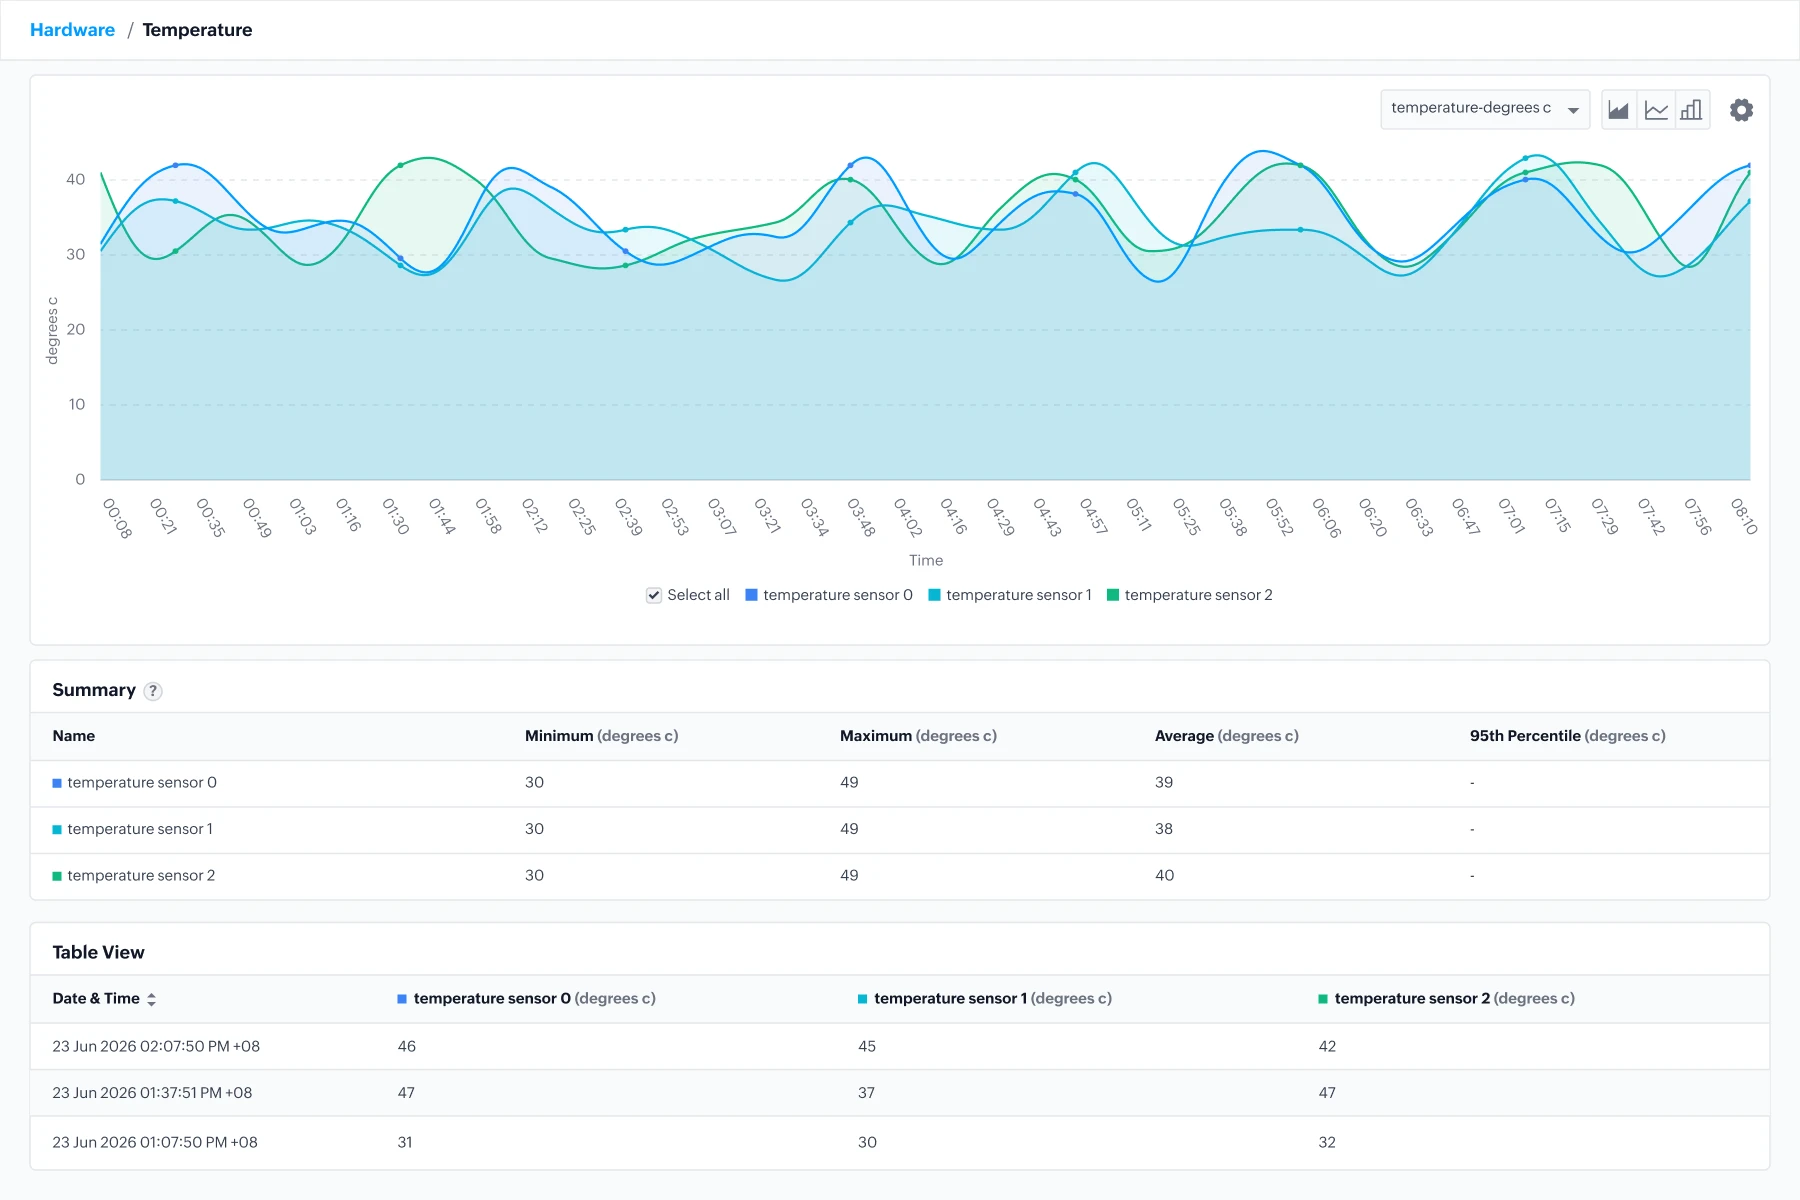
Monitor hardware sensors to prevent switch outages
- Track fan speed, temperature, and PSU health to prevent thermal shutdowns and power failures.
- Receive instant alerts through multiple notification channels when hardware thresholds spike.
- View predicted usage trends for hardware sensors to plan replacements and to prevent unexpected outages.
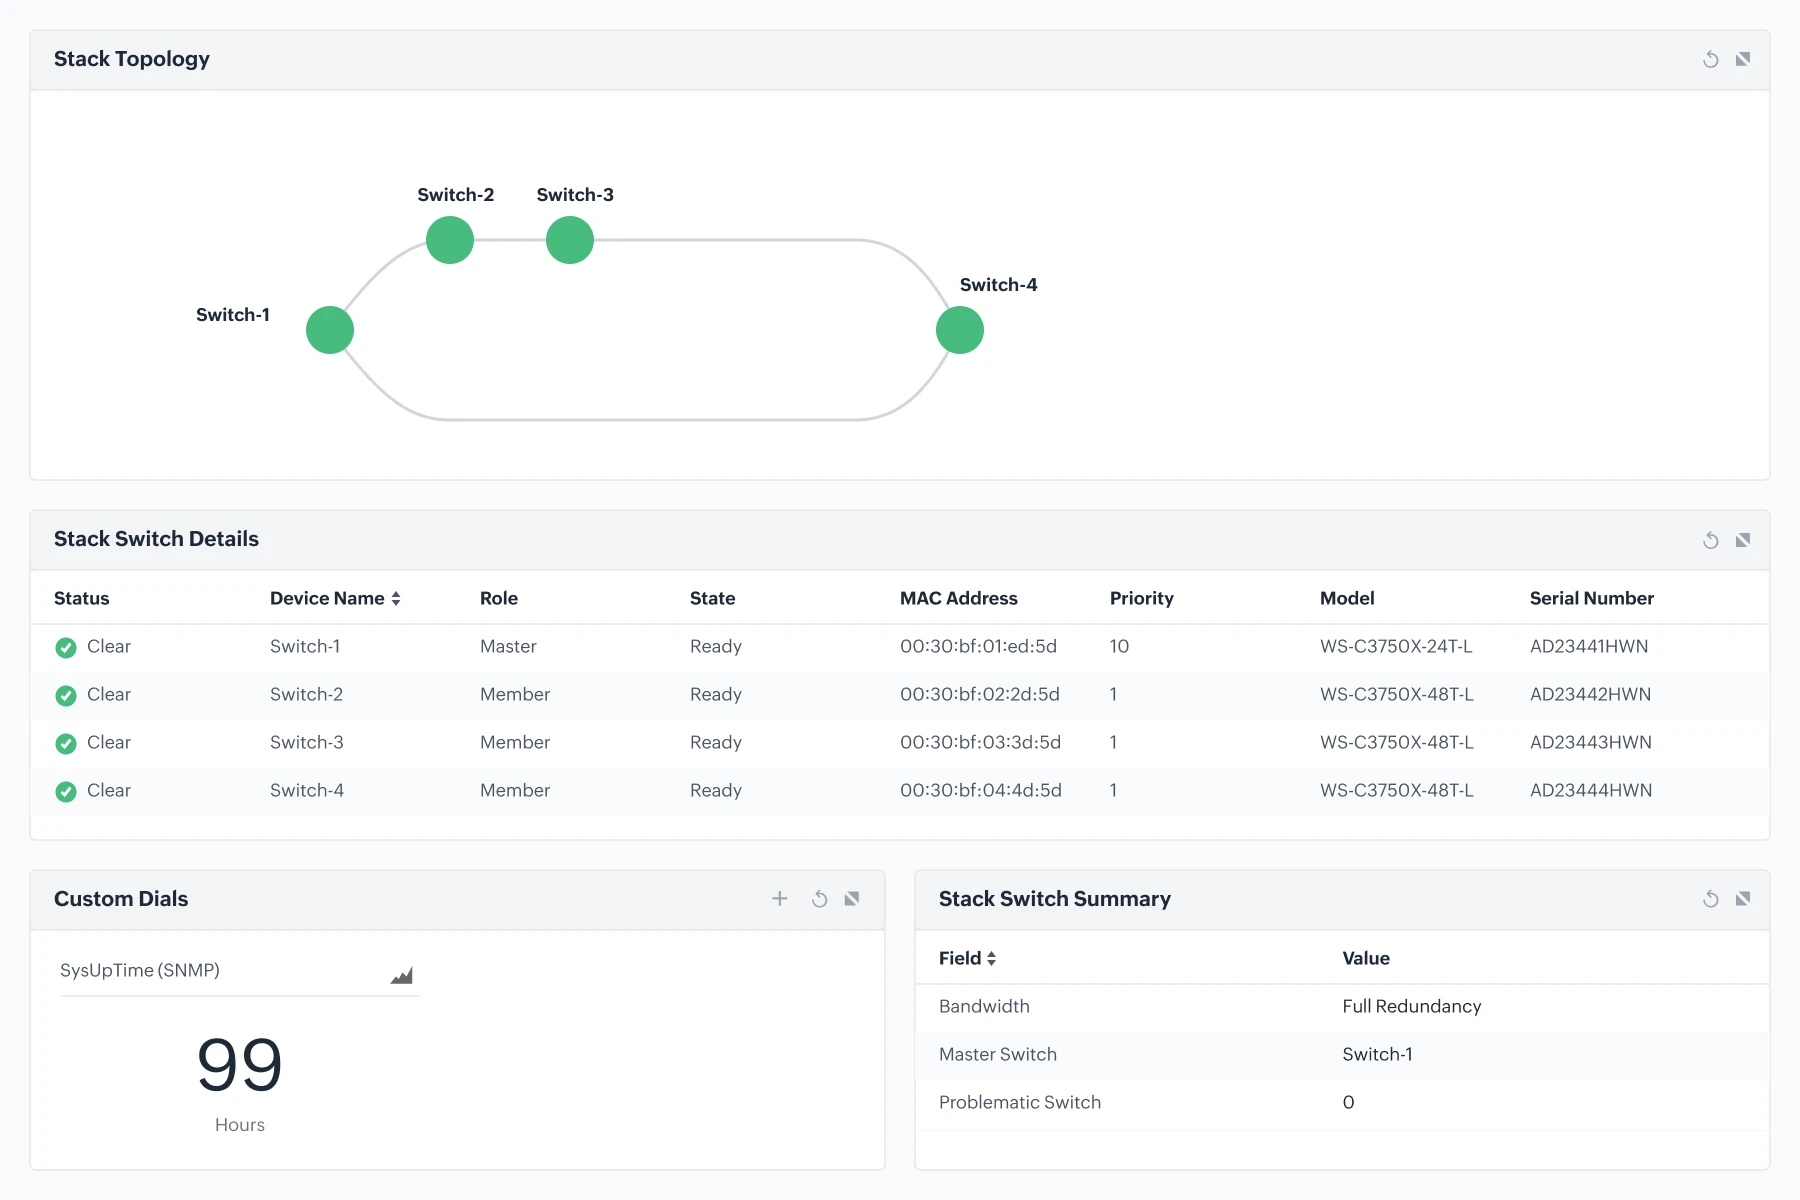
Monitor switch stacks and neighbor devices
- Track stack member roles, health, and link integrity, to prevent disruptions caused by failing stack members or unstable stack links in high-availability setups.
- Build topology maps automatically to track neighbor devices connected to a switch.
- Track mismatched cables, detect unexpected adjacency, or troubleshoot slow paths.
Discover and monitor VLAN connections
- Identify VLAN assignments across all ports effortlessly to fix VLAN misconfigurations that often cause unreachable devices or cross-segment communication issues.
- Keep segmentation clean and compliant by spotting ports mapped to wrong VLANs or unused VLANs tied to active ports.
Gain in-depth visibility with switch port mapping
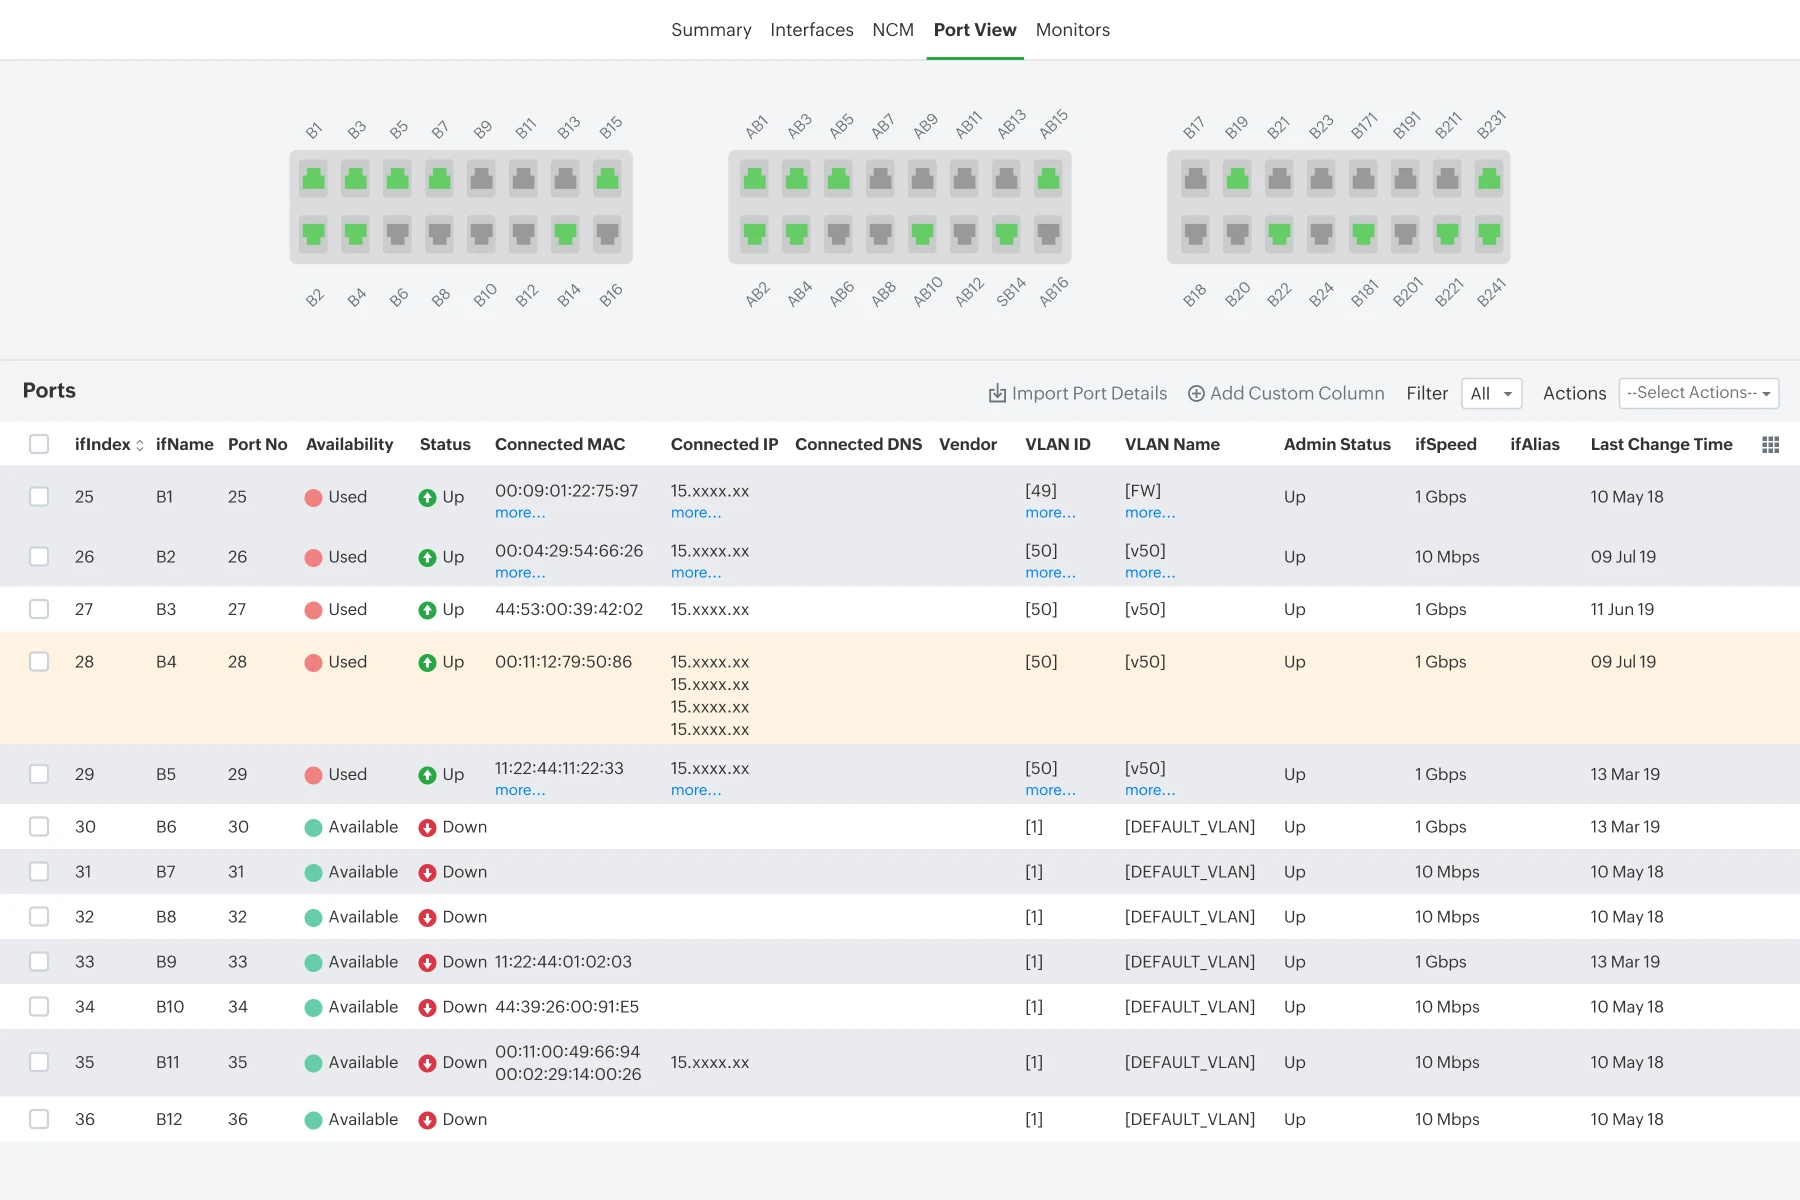
- OpManager's OpUtils add-on helps you monitor each switch port’s live status, speed, last-change, and admin state to identify link failures, flapping ports, or ports negotiating at incorrect speeds.
- Identify and trace devices instantly with automatic mapping of MAC, IP, DNS, vendor, and VLAN details.
- Use the visual port-panel layout to see your switch as it physically exists, making it easy to spot unused ports, overloaded ports, and error-prone ports.
Uncover more powerful switch monitoring capabilities with add-ons
Application traffic shaping
Gain in-depth visibility into application traffic. Prioritize traffic allocation to ensure that critical apps are always running optimally.
Network config management
Audit config versions and changes. Identify stable baselines and run quick rollbacks during to restore services during outages.
Rogue-device detection
Mark devices as trusted, guest, and rogue. Map device to switch-port connections, and block switch ports when needed.
Switch-port mapping
Use switch port maps to get a holistic picture of switch connectivity and health.
Key switch monitoring metrics supported in OpManager
Device Health & traffic
- CPU
- Memory
- Temperature
- Hardware sensors (fan/PSU)
- Bandwidth usage
Interface Stats
- Utilization (Received & transmitted)
- CRC Errors
- Discards
- Duplex Status
Port Metrics
- Port Speed
- Availability
- Admin Status
- Connected Device Count
Why IT teams choose OpManager as their switch monitoring tool
Downtime prevention
Predicts failures early with anomaly alerts on errors, overheating, and rising latency.
Rapid troubleshooting
Pinpoints the exact switch, port, or path causing slowdowns; no multi-hop guessing.
Confident scaling
Forecasts port usage, capacity, and traffic patterns so expansions happen without surprises.
Zero vendor lock
Monitor Cisco, Juniper, HPE, Aruba, and 100+ others under the same unified UI.
FAQs on switch monitoring
Resources to dig deeper
The technical playbook for deploying agentic AI in production ITOps
From alerts to action: How agentic AI will change your ITOps
Download Whitepaper→