Scalable Network Monitoring
Enterprise Fault and Performance Management
The Enterprise Edition of OpManager is designed to managing fault and performance of large networks. Enterprise networks with agent and agentless network monitoring are dynamic and keep expanding based on need, and administrators are required to provision for future growth as well. Deploy multiple Probes to distribute the load across servers and gain in–depth visibility into your network performance. Spot bottlenecks efficiently and minimize downtimes. Manage many interfaces per probe by deploying either in the same site for scalability, or in remote sites for geographically distributed network monitoring. Manage all resources either from a local console or an unified console at the NOC.
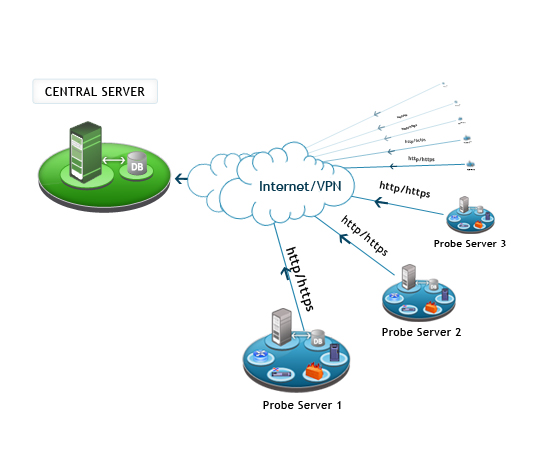
You can consider upgrading from a Standard or Professional Edition to the Enterprise Edition to scale to the growing enterprise network management needs; You can switch from a standalone to enterprise on the fly.
Scale from a handful of sites to multiple locations without adding headcount
Adding a location usually adds monitoring work: more devices to onboard, more alerts to watch, and more people checking dashboards. OpManager makes that work effortless. A probe at each site, or one probe covering several small sites, collects data locally and reports to one Central console, so your team watches one screen whether you run 5 locations or 25. Enterprise Edition scales to 50,000 devices and 100,000 interfaces.
- Onboard a site by repeating, not rebuilding: Deploy a probe, run discovery, and let group rules place devices in the right site group automatically. Configuration changes made in the Central server apply across all probes.
- Offline-device alerting: OpManager continuously checks device availability, and when a device stops responding, it raises a down alarm and notifies the right person by email or SMS. Group alarms show at a glance which sites have devices offline, and when a WAN link fails, the alarm points at the link or gateway instead of flooding you with one alert per device behind it.
- Response-time alerting: Set warning and critical thresholds on response time for each site’s gateway and critical devices, and on WAN link latency, jitter, round-trip time, and packet loss. A slow link is flagged before it becomes a down link.
- Automated escalation over constant monitoring: Critical alarms that go unacknowledged automatically escalate to a second person, and workflows can handle routine first-level checks, helping small teams manage a growing infrastructure without staffing every shift.
- No gaps when a link drops: If a site loses its connection to the Central server, its probe keeps collecting data in a local database and sends it once the connection returns, so reports for that site stay complete.
Say a branch gateway stops responding at 2 a.m. on a network with 20 locations. The alarm reaches the on-call engineer within the monitoring interval, the group view shows that only that site is affected, and, if nobody responds, the alarm escalates automatically. Nobody has to be watching a dashboard.
Multi-site monitoring with probes is part of OpManager Enterprise Edition. See editions and pricing for what each edition includes.