Monitoring Windows Event Logs - A Tutorial
Part II - Implementation
Welcome to Part II of Event Log Monitoring tutorial. At the end of this tutorial, you will be able to successfully implement Windows Event Log monitoring in your network. If you are a beginner, you might want to check out Part I covering the basics of Event Logs.
Centralized Event Logs Monitoring
Here is an outline of the topics covered in this tutorial:
- An overview
- How Event Log Monitoring works
- Top Event Logs to be monitored
- Mapping Event Logs variables to OpManager alerts
- Configuring Event Log Monitoring
- Other useful links
An Overview
The Event Logs record all the happenings on the device and bear clues to several security hacks and application performance issues. It is a tedious task for an administrator to manually check and track issues on each and every Windows device. Tracking specific events across all Windows devices with a unified console makes event management easy. A solution that is capable of monitoring event logs actually parses the Windows events and shows the processed events along with the other alerts triggered by the solution, providing the flexibility to the administrator to handle complete network fault management from one window.
OpManager is a network monitoring solution that monitors the performance of all the resources on your network and manages the network fault. Extending its network fault management capability, OpManager also monitors Windows and Unix logs. The following sections of the tutorial helps you configure monitoring of Windows Event logs using OpManager.
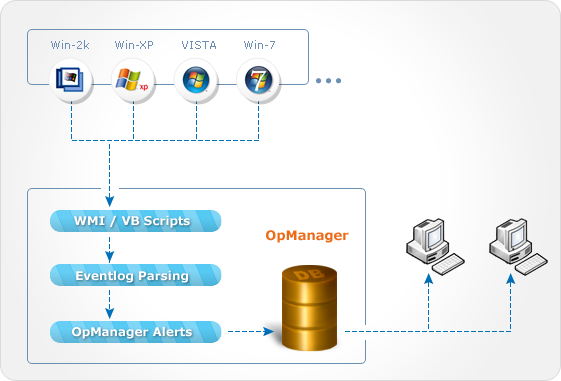
How Event Log Monitoring Works
- The OpManager server acts like a centralized Syslog server that collects messages from different monitored devices. OpManager authenticates to the Windows devices on the network using WMI and gathers the specifed Event Log messages.
- The Event Log messages are collected and parsed into OpManager events based on the processing criteria defined as part of the Event Log rules. The event log rules are customizable.
- These events are then correlated as OpManager Alerts and are displayed in the OpManager Alarms GUI. The events are not displayed to avoid cluttering the view.
- You can connect to the Web client or the Smartphone GUI to view the alarms.
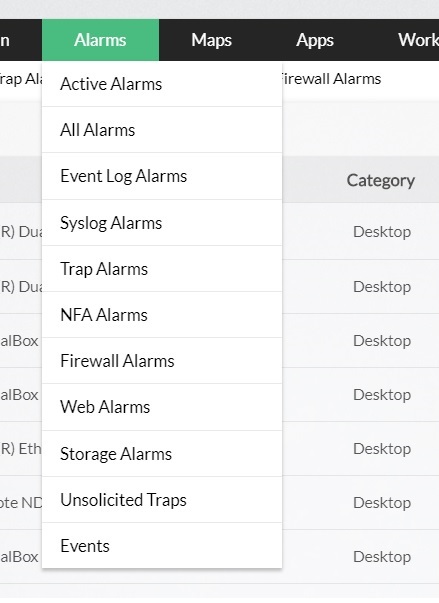
- To view only the alarms triggered by Windows Event logs, go to the Alarms tab and select the menu and select Event Log Alarms.
Top Event Logs to be monitored
Here's a list of recommended security event logs that need monitoring. Make sure you identify other security issues that are specific to your enterprise and log them for monitoring.
| Windows Event ID | Windows Vista Event ID | Event Type | Description |
|---|---|---|---|
| (512 to 516), (518 to 520) | (4608 to 4612), (4614 to 4616) | System Events | Identifies local system processes such as system startup and shutdown and changes to the system time |
| 517 | 4612 | Audit Logs Cleared | Identifies all the audit logs clearing events |
| 528, 540 | 4624 | Successful User Logons | Identifies all the user logon events |
| (529 to 537), 539 | 4625 | Logon Failures | Identifies all the failed user logon events |
| 538 | 4634 | Successful User Logoff's | Identifies all the user logoff events |
| 560, (562 to 568) | 4656, (4658 to 4664) | Object Access | Identifies when a given object (File, Directory, etc.) is accessed, the type of access (e.g. read, write, delete) and whether or not access was successful/failed, and who performed the action |
| 612 | 4719 | Audit Policy Changes | Identifies all the changes done in the audit policy |
| (624 to 630), 642, 644 | 4720, (4722 to 4726), 4738, 4740 | User Account Changes | Identifies all the changes done on an user account like user account creation,deletion, password change, etc. |
| (631 to 641), 643, (645 to 666) | (4727 to 4737), (4739 to 4762) | User Group Changes | Identifies all the changes done on an user group such as adding or removing a global or local group, adding or removing members from a global or local group, etc. |
| 672, 680 | 4768, 4776 | Successful User Account Validation | Identifies successful user account logon events, which are generated when a domain user account is authenticated on a domain controller |
| 675, 681 | 4771, 4777 | Failed User Account Validation | Identifies unsuccessful user account logon events, which are generated when a domain user account is authenticated on a domain controller |
| 682, 683 | 4778, 4779 | Host Session Status | Identifies the session reconnection or disconnection |
Besides the above security related events, enable and track logging for mission critical applications and system resources.
Mapping Event Logs variables to OpManager alerts
The Event Logs are filtered for parsing into OpManager alerts based on the Event Log properties listed below. The table shows a loose mapping of the event log properties and the corresponding alert properties for easy understanding:
| Windows Event Log Properties | Corresponding OpManager Alert Properties |
|---|---|
| Event Types (Error, Warning, Information) | Alert Severity (Critical, Attention, Trouble, Clear) |
| Date | Date/Time |
| Time | Last Updated (time) |
| Source (the resource at fault) | Entity (the resource at fault but name not displayed in GUI) |
| Description | Message |
Configuring Event Log Monitoring using OpManager
Prerequisites
- Before moving your servers to the production environment you should verify whether pre-determined values (size and overwriting options) for event logs well suits your environment. Change the values based on your enterprise's needs.
- OpManager authenticates to the remote Windows devices in your network using WMI to fetch the event logs. Make sure you have a list of the correct domain names, user names with administrative privilege, and the corresponding passwords to enable authentication.
- The windows devices on which you want the event logs monitored, must be discovered in OpManager.
Steps to configure monitoring
- Configuring WMI Credentials
- Monitoring Windows Events in a device
- Using the Quick Configuration Wizard
- Creating an Event Log Monitor
- Monitoring Custom Event Logs
- Viewing Event Log-based Alerts in OpManager
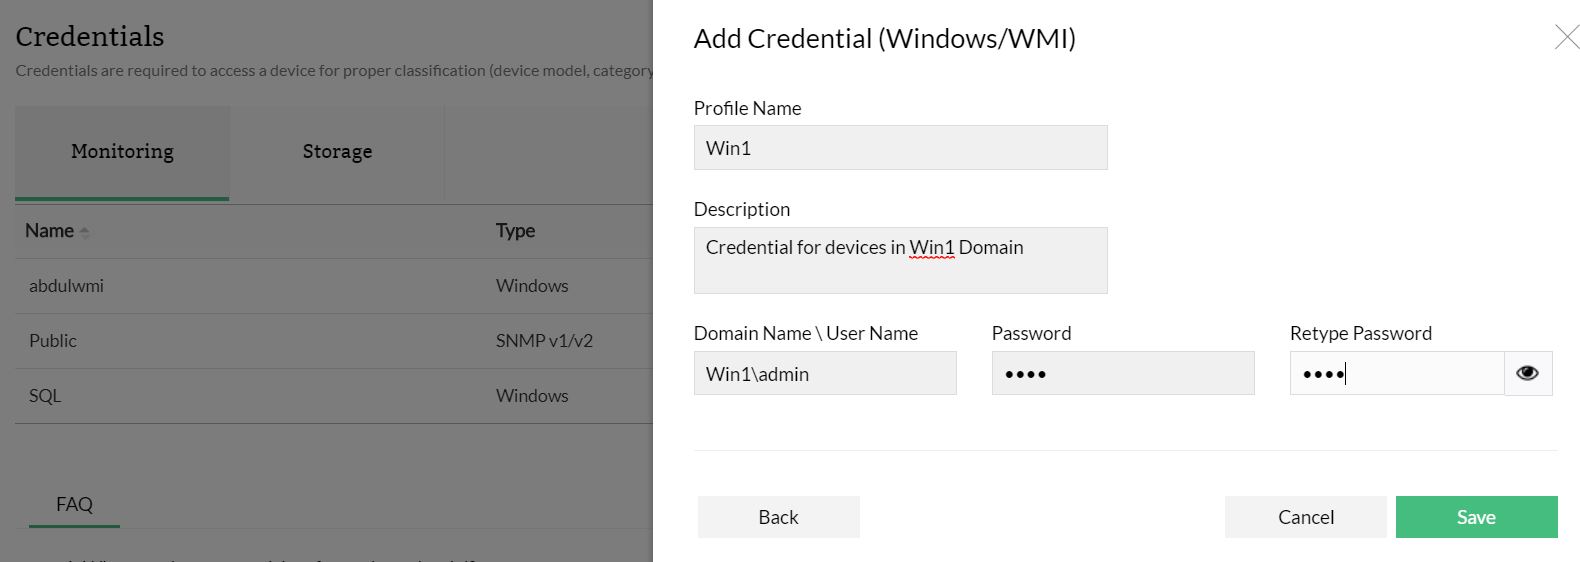
Configuring WMI Credentials
- In the OpManager GUI, go to Settings --> Discovery --> Credentials.
- Click Add Credentials and choose a classification.
- Configure the credential name and description.
- Configure the following parameters and click Add to add the credentials:
- the Domain Name/ the user name
the password.
Example:- TestDomain\TestUser.
Monitoring Windows Event Logs in a Device
OpManager has over 50 Event Log monitors out-of-the-box. To monitor Windows event logs, you need to associate the event log monitors to the devices. To do so, follow the steps given below:
- Go to Device page --> Monitors --> Actions (Top right corner).
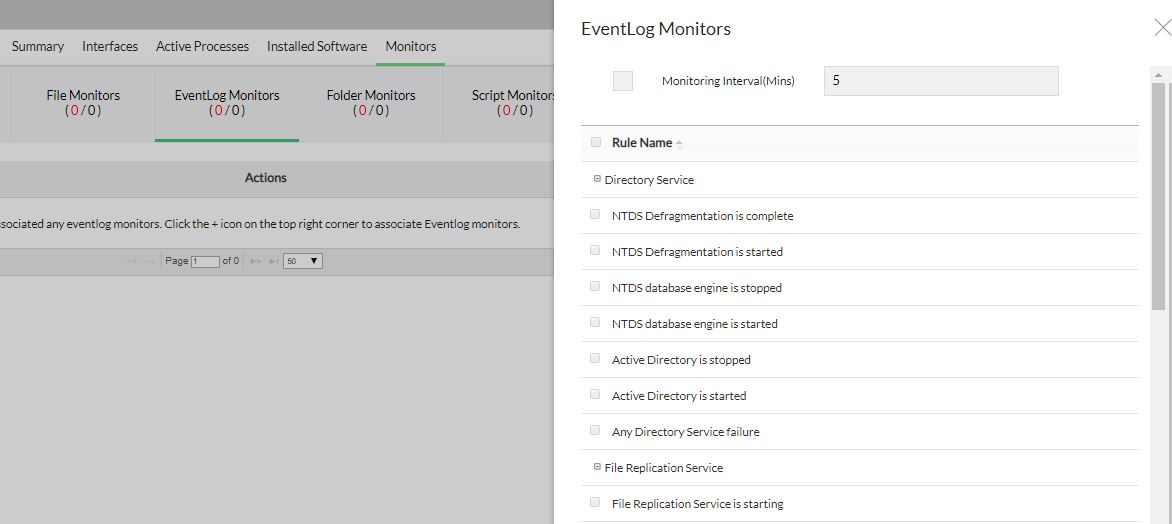
- Select the event logs to be monitored in the device.
- Change the Polling Interval if necessary. During each poll, the selected event logs are compared with the events logged in the device and for the matching events, alarms are generated.
- Click Save to save the changes.
Using the Quick Configuration Wizard
Alternatively, you can associate an event log rule with many devices at a time using Quick Configuration wizard.
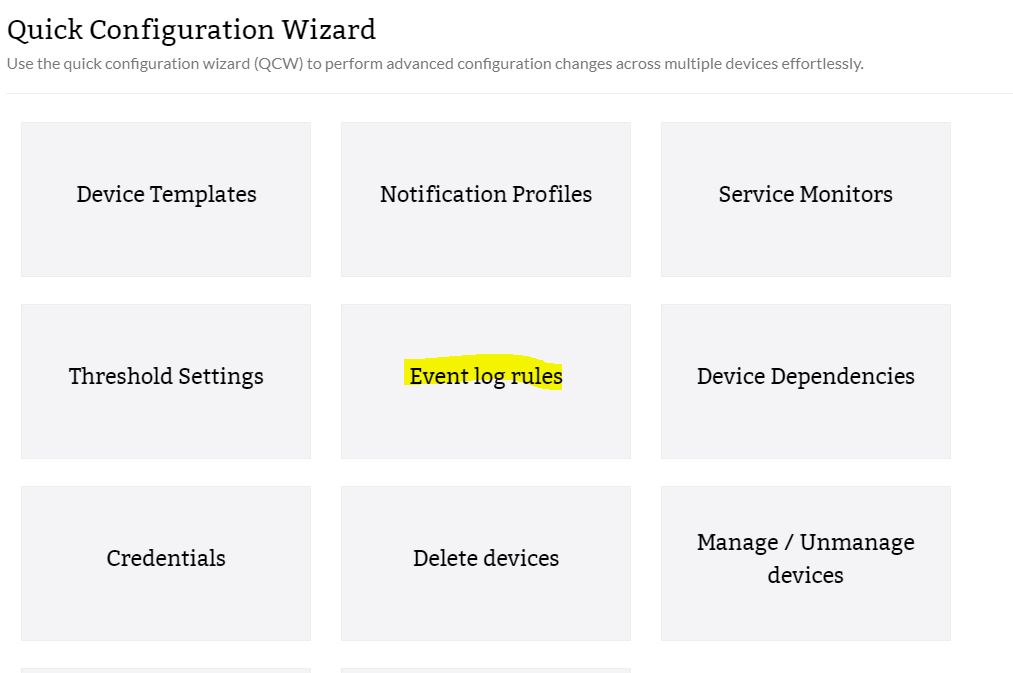
- From the Settings tab, go to Configuration and select Quick Configuration Wizard.
- Select the log file from the displayed list.
- Choose any one rule from the list of rules shown.
- From the list containing All Devices, select the devices on which you want to monitor the event logs from and move them to the Event Log Associated Devices on the right.
- Click Save. The event log monitor is associated to the selected devices.
Creating a New Event Log Monitor
To create a new event log monitor, follow the steps given below:
- Under the Settings tab, go to Monitoringand select Event Log Rules.
In this page, you can see the rules supported by OpManager. They are categorized into Applications, Security, System, DNS Server, File Replication Service, and Directory Service. You can add the event logs that you want to monitor under any of these categories.
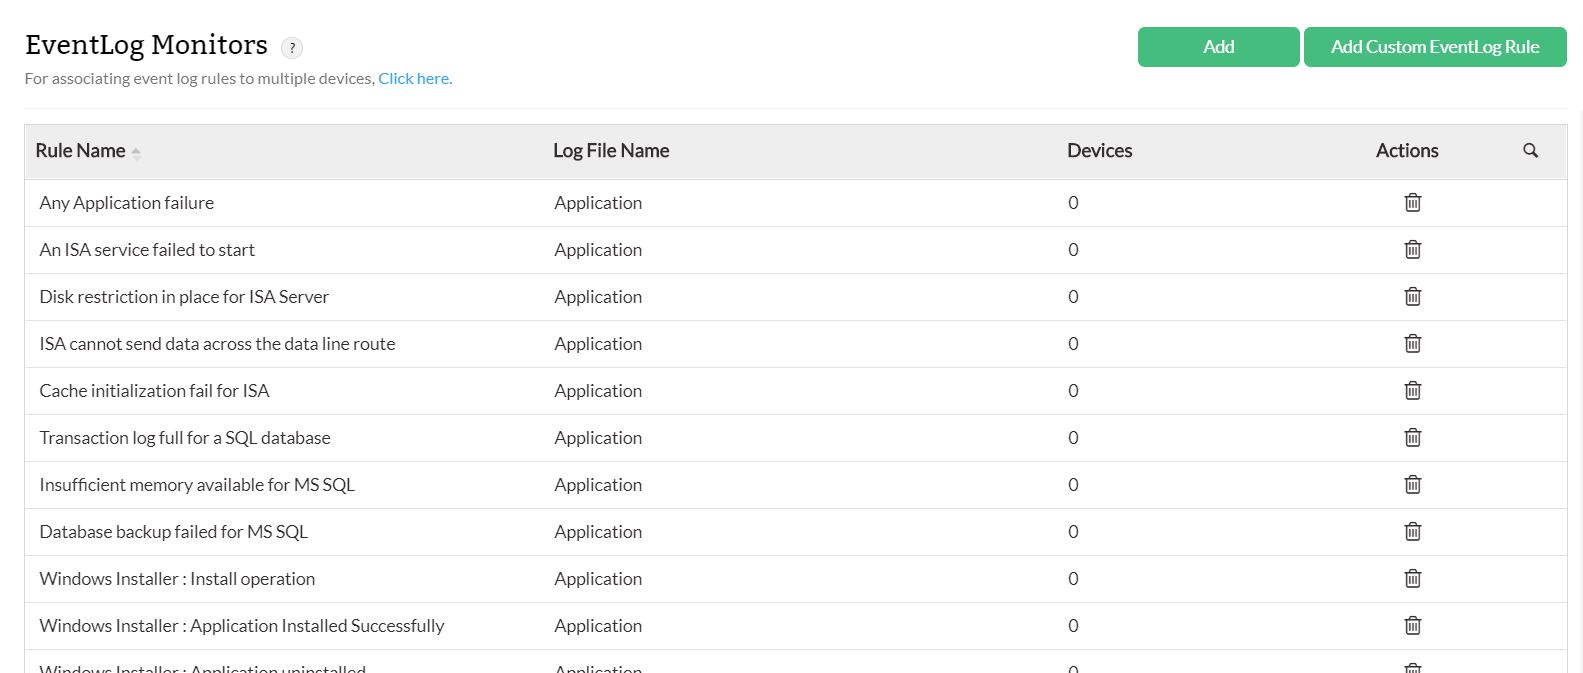
- Click Add.
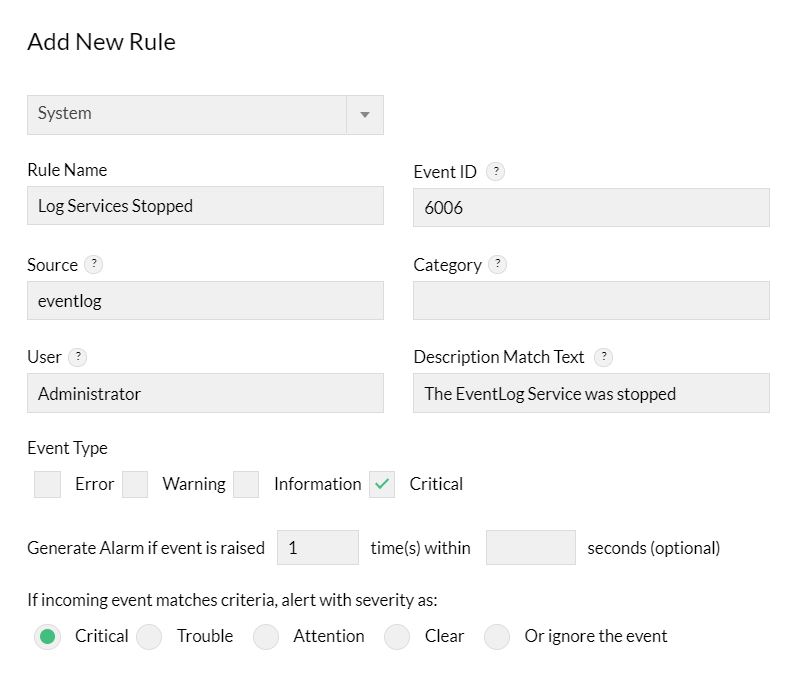
Entries to all the fields except Rule Name are optional. Event ID is a required field to identify the event but can be left empty in few exceptional cases, such as you want to monitor all events that are of the Event Types, say, error or information. Here the filter will be based on the Event Type.- Select a Log File Name from the drop down box
- Type a unique Rule Name.
- Enter the Event ID to be monitored. This is the unique identifier for the event logs.
- Enter the event Source. This is the name of the software that logs the event.
- Enter the event Category. Each event source defines its own categories such as data write error, date read error and so on and will fall under one of these categories.
- Type the User name to filter the event log based on the user who has logged on when the event occurred.
- Choose the Event Types to filter the event logs based on its type. This will typically be one among Error, Warning, Information, Security audit success and Security audit failure.
- An accurate Description Match text helps you to identify the New Rule much faster.
- Decide when to generate an alarm by specifying the number of times the event should be raised within a specified time.
- Choose a severity for the alarm generated in OpManager for this event.
Click Save to save the event log rule.
Monitoring Custom Event Logs
You can monitor event logs under a custom category too. Some application events can be logged in a new category other than the default System/Applications/Security categories, enabling easy administration. You can now configure rules in OpManager to parse the events in such custom categories and trigger corresponding alerts in OpManager.
Here are the steps:
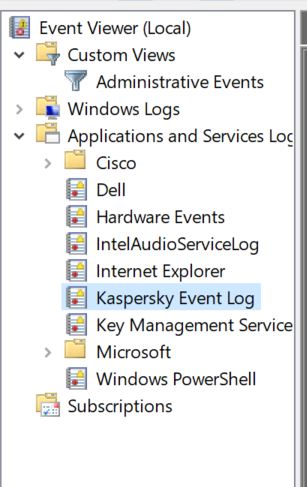
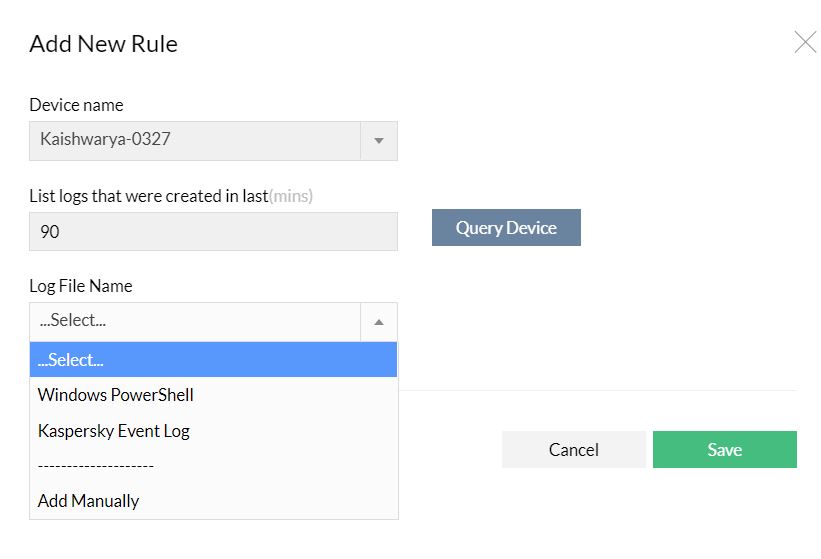
- Go to Settings --> Monitoring --> Event Log Rules --> Add Custom Event log (you will find this option on the top right corner on this screen).
- Select a device from which you can query for the event categories and hit Query Device. The custom log categories in the selected device are listed.
- Select the category of events that you want monitored across the Windows devices and click Add.
- The new category is listed along with the other categories under Settings --> Event Log Rules.
Click Save.
After you add the custom event category, you will find the category listed under Settings --> Monitoring --> Event Log Rules. Go on to add new rules to parse the events falling under this category.

- You can now associate the rules (default or custom event logs) to the required devices and monitor them. Go to the device snapshot page and select a device. Click on Monitors and choose Event Log Rules monitors to select and associate the log rules.

Viewing EventLog-based Alerts in OpManager
After you associate the Event Log Monitors to the devices, OpManager monitors for events of the criteria defined in the Event Log Rule. When there are events matching the criteria, OpManager processes the Event Logs into OpManager Alerts. You can view these alerts in OpManager GUI:
- Hit the Alarms tab in OpManager GUI. You will find all the alarms listed.
Select the Event Log Alarms to view alerts with Event Logs as source.