Virtual machines (VMs) are central to modern IT infrastructure, enabling organizations to consolidate workloads, scale efficiently, and optimize costs. VMware's ecosystem, including vSphere, ESXi, vCenter, and vSAN, provides a robust virtualization platform trusted by enterprises worldwide. However, this abstraction introduces challenges such as visibility gaps across hosts and clusters, resource contention, storage bottlenecks, and complex networking dependencies. These complexities underscore the importance of proactive monitoring and management to ensure performance, availability, and business continuity.
VMware monitoring involves collecting and analyzing operational data from every layer of a VMware-powered virtual infrastructure. It focuses on core components such as:
Data is typically gathered via the vSphere API, WMI, or SNMP protocols. Advanced monitoring tools must handle real-time polling, historical data retention, event correlation, and alerting while adapting to frequent changes in VM placement due to features like vMotion and DRS.
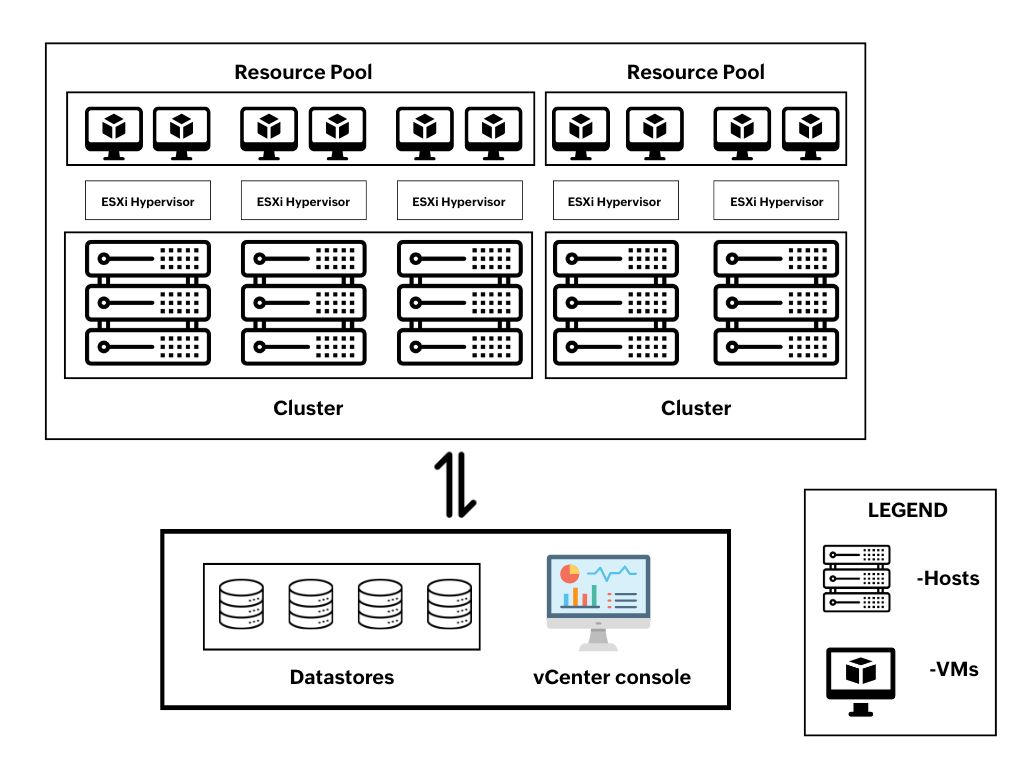
To effectively monitor a VMware environment, you must first understand its architecture.

Pro-tip: Avoid sharing a single datastore across multiple clusters or vCenter instances. While technically possible, features like HA, DRS, and vMotion do not span cluster or vCenter boundaries. Doing so also increases risks of conflicts, contention, and management complexity. Have adequate mechanisms to handle conflicts in case of going for a single datastore for multiple clusters.
While VMware offers excellent virtualization capabilities, monitoring its environment presents unique technical challenges:
Features like vMotion allow VMs to migrate across hosts in real-time. This means a VM’s host, IP address, or resource profile can change frequently, requiring monitoring tools to track these relationships dynamically to maintain metric continuity.
APIs like vSphere’s often have polling intervals and rate limits. This introduces lag in metric collection and can cause missed spikes or slow alerting in high-load scenarios, especially when monitoring hundreds or thousands of VMs and hosts.
As environments grow, so does the overhead of collecting metrics. Without efficient polling and caching strategies, large-scale VMware environments can overwhelm the monitoring infrastructure and lead to dropped data or false positives.
In heterogeneous network environments, VMware's native monitoring solutions face limitations, as they primarily focus on VMware-specific metrics and objects. They often struggle to provide end-to-end visibility across mixed hypervisors, storage systems, and third-party devices. This gap can lead to blind spots, delayed issue detection, and increased reliance on multiple monitoring tools.
Monitoring physical components like temperature sensors, fan RPMs, and power supplies is not natively handled by many monitoring tools, yet is critical to pre-empt hardware failures that can cascade into virtual service outages.
Without proper correlation between VM, host, and storage events, the same root issue (e.g., a saturated datastore) can trigger alerts across dozens of VMs, cluttering incident queues and slowing resolution.
ManageEngine OpManager is built to overcome these monitoring challenges with a technically advanced and scalable solution.
OpManager's Virtual machine monitoring helps you monitor your CPU usage, memory pressure, disk throughput, and network traffic for every VM. It also captures VMware-specific metrics like ballooning, swapping, and CPU ready time, thereby offering insight into both guest and host-side behavior.
Our ESXi host monitoring includes CPU/memory usage trends and hardware sensor data. You can detect host-level failures like PSU degradation, NIC flaps, or overheating, thereby preventing physical faults from cascading into VM downtime.
OpManager integrates with vCenter to automatically discover the full VMware topology including hosts, clusters, VMs, and datastores. It provides visibility into environments running DRS and HA by tracking VM migrations, host availability, and resource allocation, allowing operations teams to monitor their performance.
Seamlessly track vSAN datastore performance. OpManager captures read/write latency, IOPS, and capacity thresholds, providing early warnings before storage becomes a bottleneck across multiple workloads.
OpManager uses multi-layer correlation to link VM performance issues to host, storage, or network root causes. This reduces alert fatigue and helps operators act on meaningful incidents. Combined with real-time Organization Maps and customizable dashboards, it delivers intuitive full-stack visualization and context-aware alerting, offering clear, comprehensive insight into your infrastructure.
All metrics are stored long-term, enabling teams to view usage trends, generate compliance reports, and forecast when CPU, memory, or storage resources will reach critical thresholds. With forecasting performance trends and capacity planning reports, IT teams gain clear visibility into resource growth patterns, helping them proactively allocate capacity and avoid service disruptions.
OpManager harnesses AI and ML for smarter network monitoring such as automated performance monitoring, predictive remediation, trend forecasting, and more. It also offers robust REST APIs for integration with third party platforms or custom applications including orchestration platforms. Furthermore, VMware events can be exported via syslog to SIEM systems for real-time monitoring and forensic analysis.
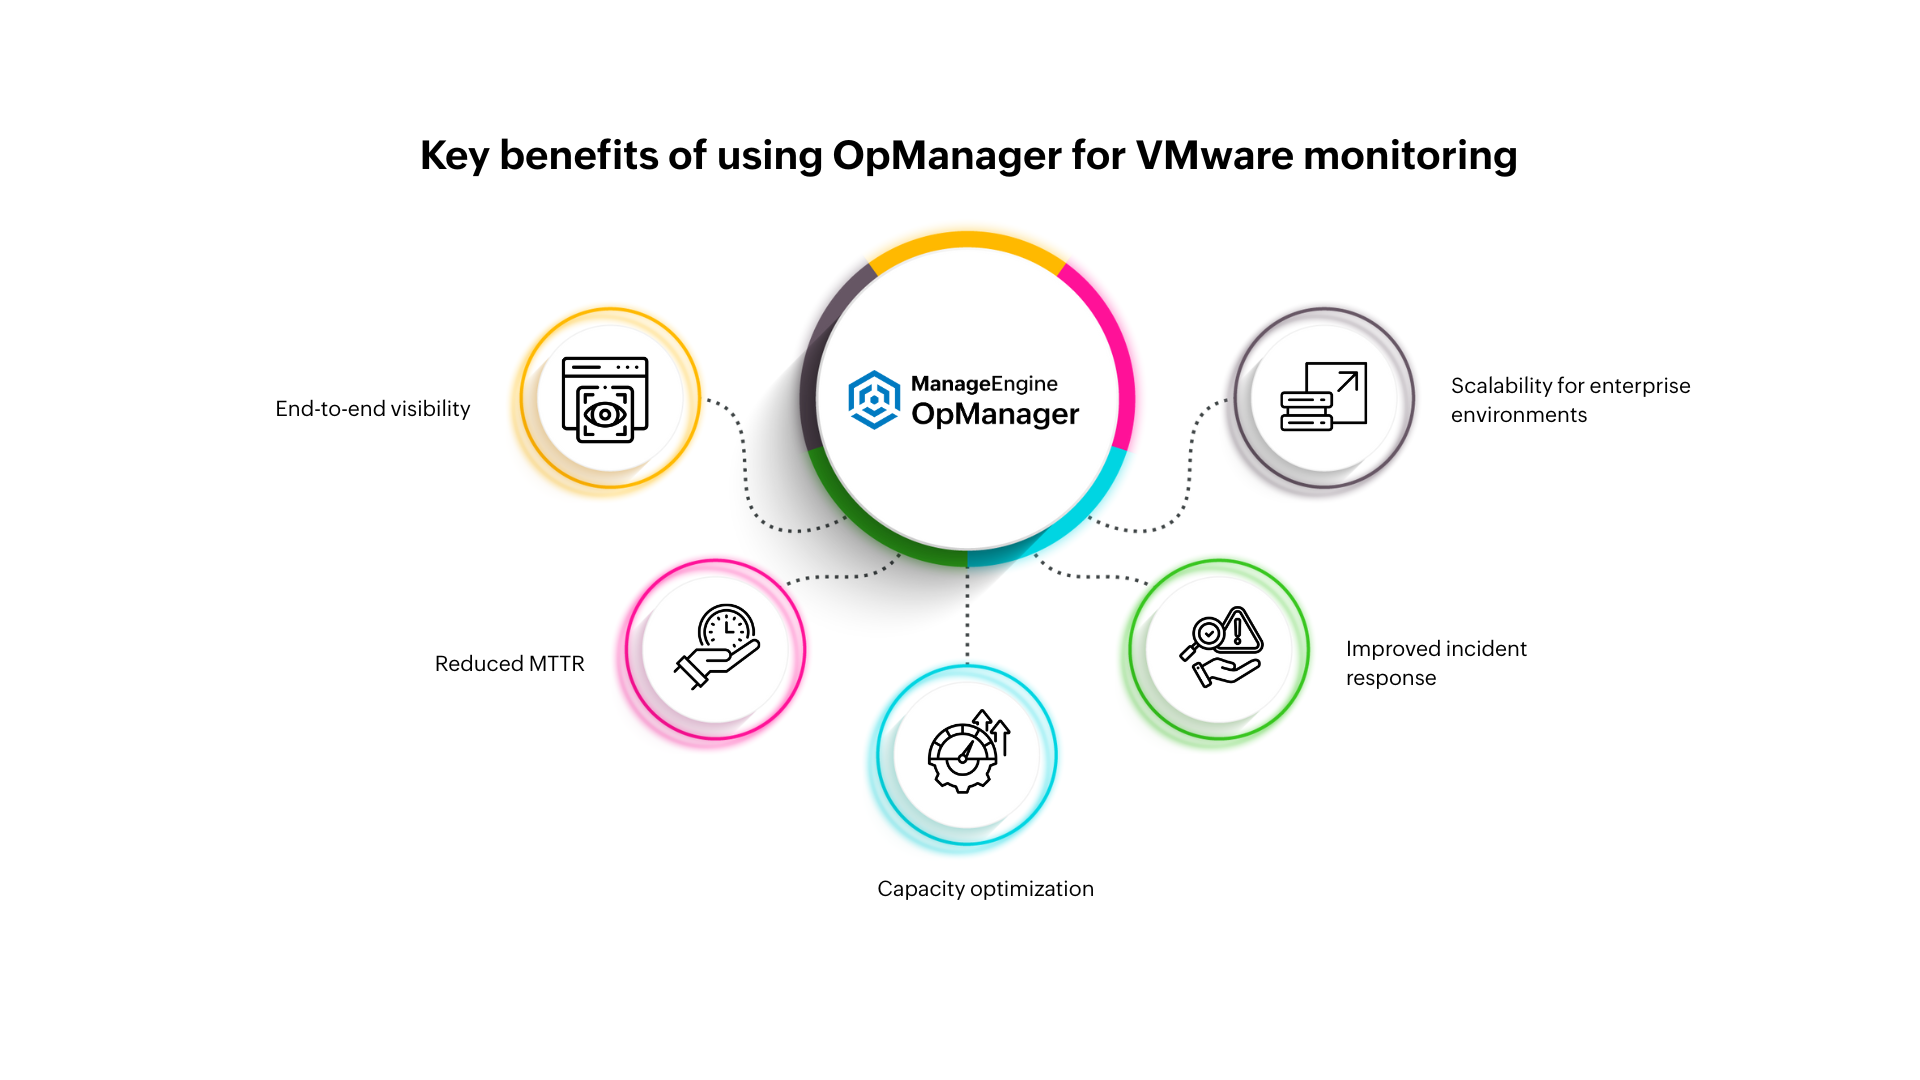
Here are some key takeaways from OpManager’s VMware monitoring capabilities.

As VMware environments continue to scale and evolve, visibility into the health and performance of every component becomes essential, not optional. ManageEngine OpManager delivers enterprise-grade VMware monitoring with deep vCenter integration, real-time analytics, cross-layer correlation, and AI-powered automation, all in a single pane of glass. It empowers IT teams to proactively manage virtual infrastructure, enhance performance, and ensure uninterrupted business services.
To explore our full functionalities, download OpManager for free or request a personalized demo from our product experts.