What is server uptime?
Server uptime refers to the time duration a server has been operational without crashes or reboots. For example, “99.9% uptime” means that the server is expected to be down for 1 minute and 30 seconds per day and over a year expected to be down for less than 9 hours. High server uptime ensures business continuity, builds customer trust, and most importantly reduces revenue loss due to downtime.
How to check server uptime?
There are two main approaches to monitoring server uptime: one is the manual method using the operating system’s native tools, and the other is monitoring through a centralized monitoring solution.
Using command line on Linux servers
The following section briefly discusses the built-in commands in Linux to check uptime:
1. Command to monitor uptime
| Command | uptime |
| Example Image |  |
2. Command to track boot time
| Command | who -b |
| Example Image |  |
3. Command to fetch startup performance metrics
| Command | systemd-analyze |
| Example Image |  |
Using Command Line on Windows Servers
In Windows users can check uptime through the command prompt or PowerShell:
1. Command Prompt
| Command | systeminfo | find "System Boot Time" |
| Description | Displays the last system boot time. |
| Example Image |  |
2. Powershell
| Command | (get-date) - (gcim Win32_OperatingSystem).LastBootUpTime |
| Description | While the cmd provides the last boot time, PowerShell provides the exact uptime duration since the last reboot. |
| Example Image | 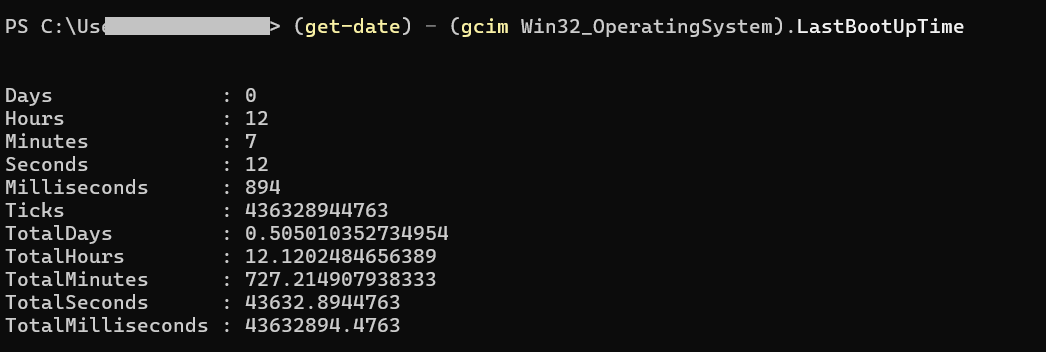 |
Ensure server uptime with a sever monitoring tool: OpManager Capabilities
While the manual methods like using system commands on Windows or Linux servers can work for small setups, adopting these traditional approaches for large scale network infrastructures, is time-consuming and inefficient. A network and server monitoring solution like OpManager simplifies uptime tracking by automatically monitoring not just server availability but also key performance metrics. It further offers detailed, actionable insights to help you quickly identify and resolve issues that could lead to downtime. OpManager continuously pings devices at configured intervals to fetch their availability status, and you can easily view uptime trends using the availability timeline.

During periodic server maintenance, you can leverage the downtime scheduler option and prevent raising alerts as the server are down intentionally. OpManager also monitors critical hardware parameters such as fan speed, power supply, and cooling units, ensuring that your servers remain healthy and available. Ultimately this enables you safeguard uptime and ensure high availability. Let us see how you can leverage OpManager's server monitoring capabilities to maximize server uptime.
1. Prevent downtime with instant alerts and forecasting
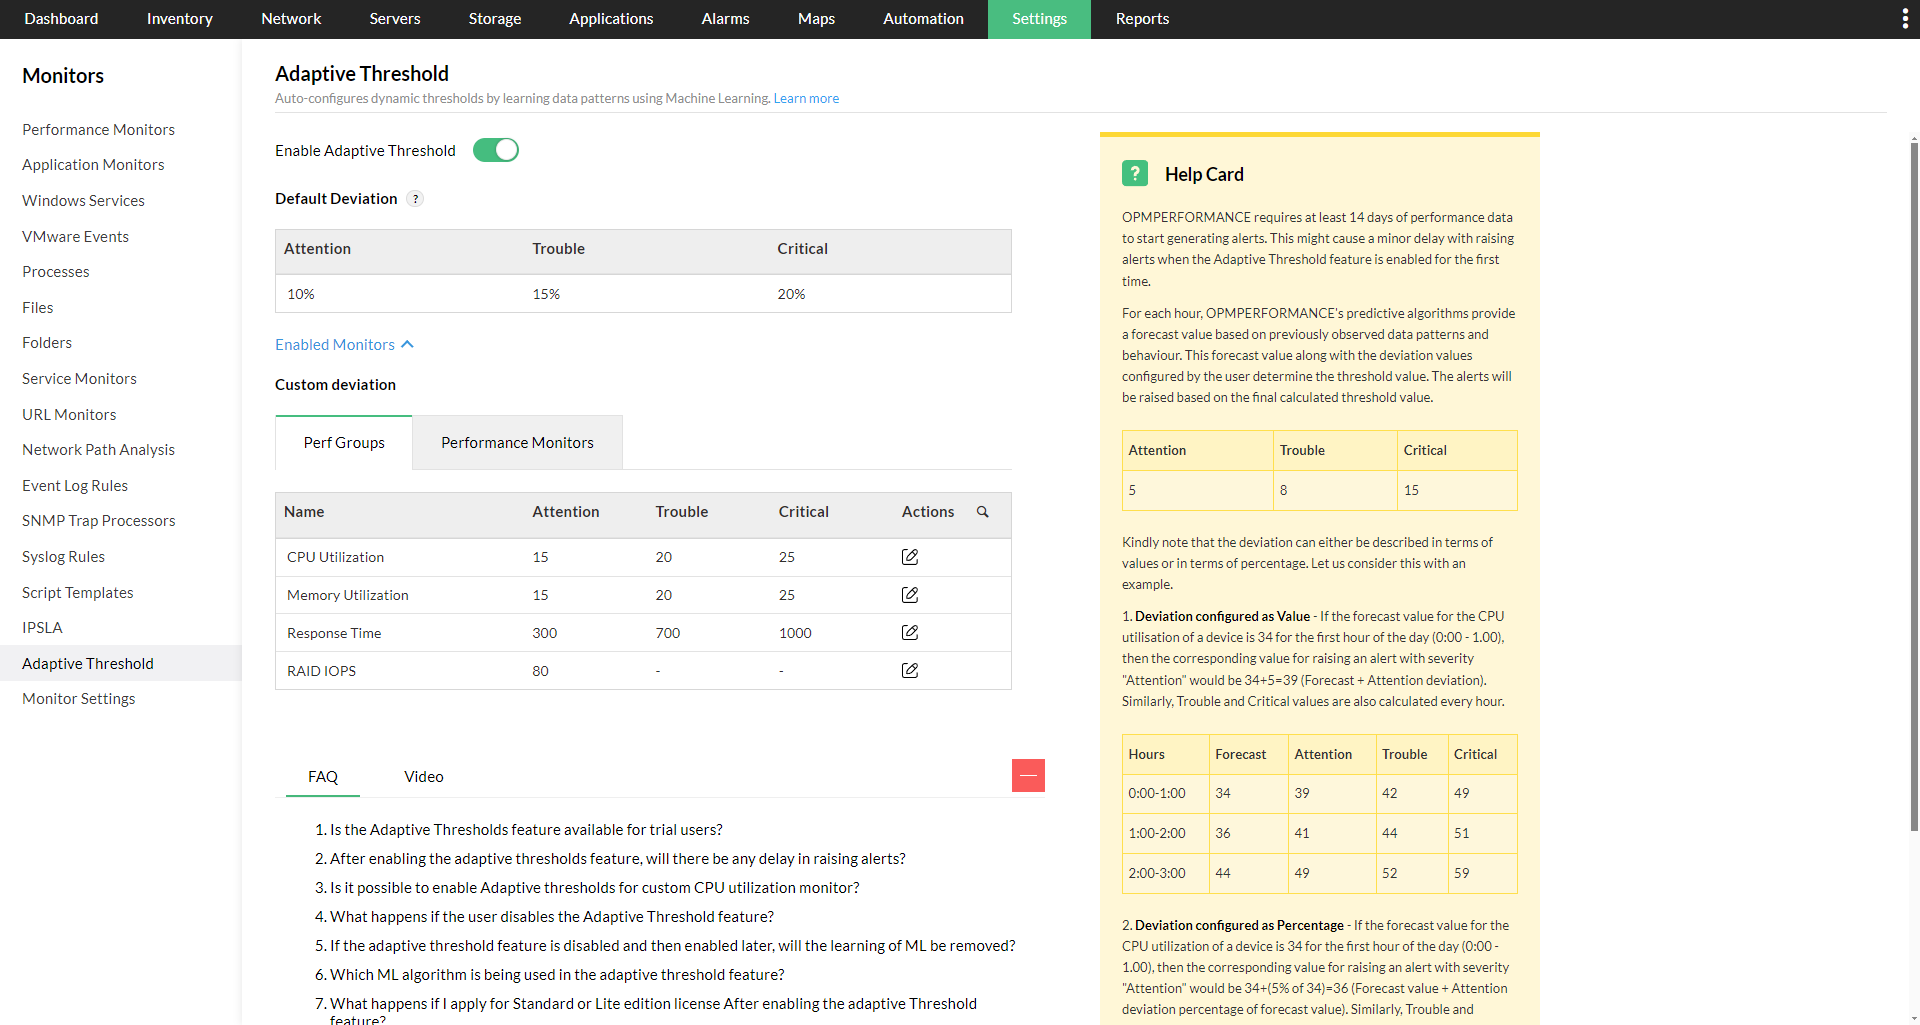
OpManager continuously monitors key server metrics such as CPU, memory, disk usage, and network performance. When a device crosses its threshold for a metric, OpManager sends instant alerts via email, SMS, or push notifications, enabling IT teams to respond immediately and prevent outages. By leveraging machine learning (ML), OpManager’s adaptive thresholds feature automatically analyzes historical server performance data and usage patterns to set dynamic, context-aware thresholds for key metrics such as CPU, memory, disk usage. Instead of relying on static, one-size-fits-all limits, these thresholds adjust over time based on usage trends. Whenever a server metric exceeds its dynamically calculated threshold, OpManager instantly raises an alert, allowing IT teams to identify potential performance issues, resource exhaustion, or abnormal activity before it impacts applications or end-users.
2. Plan for capacity expansion with reports
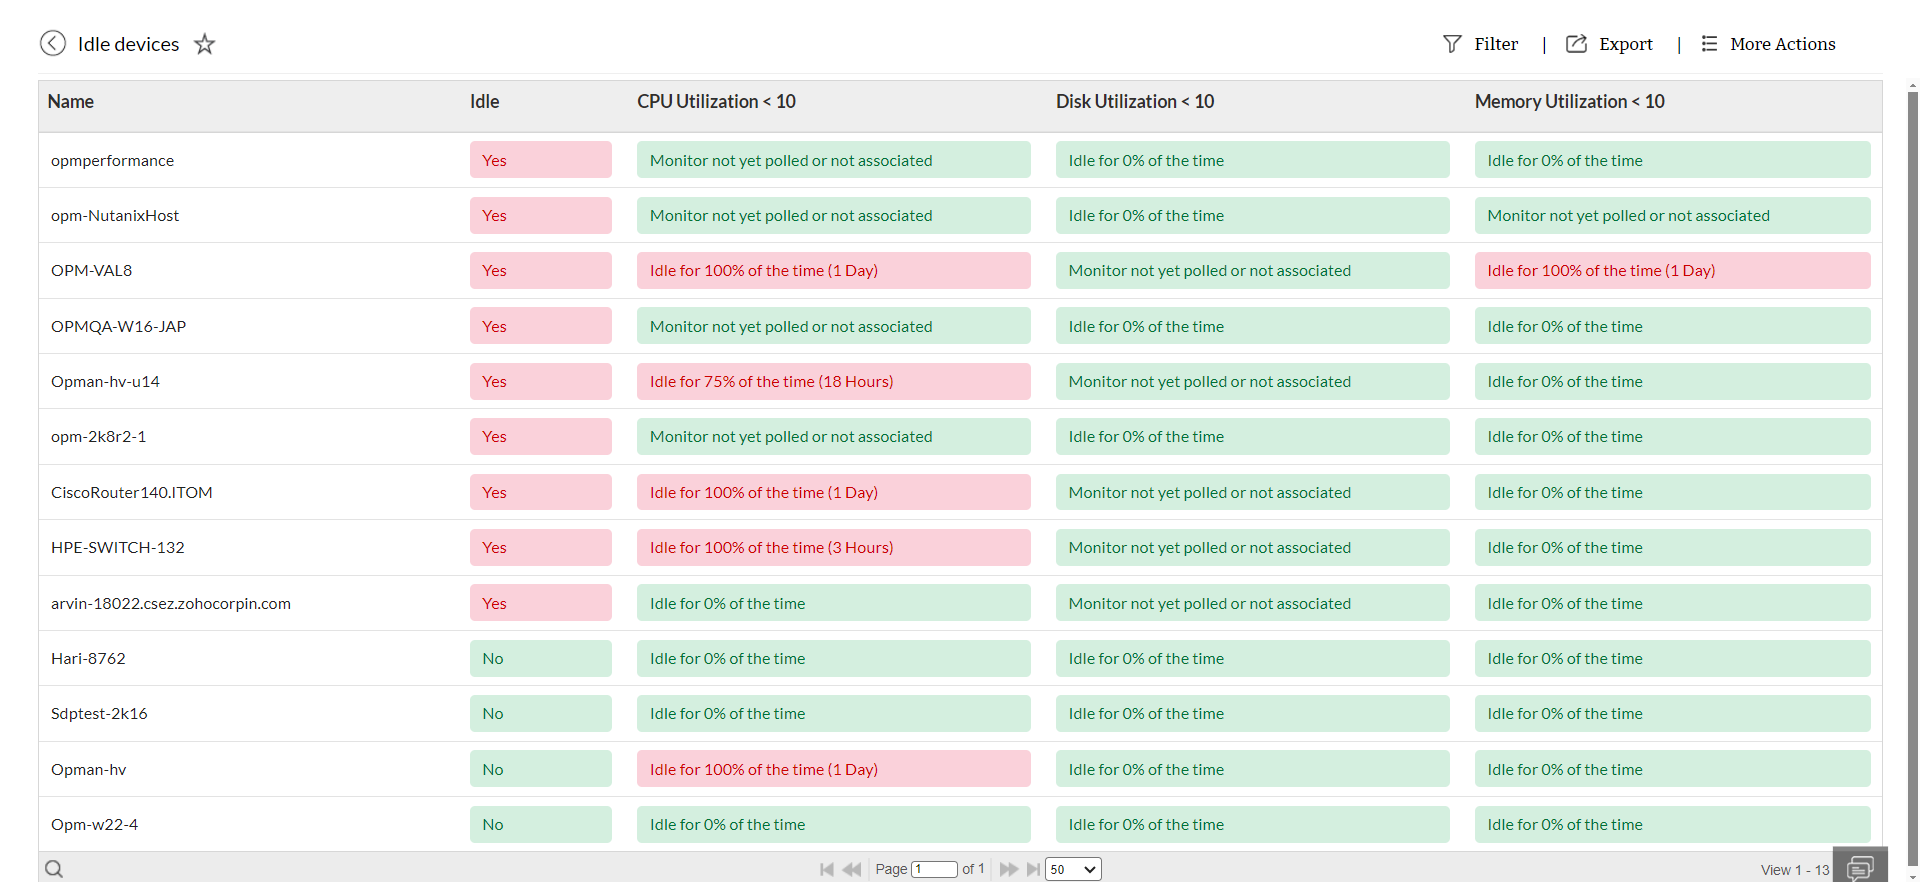
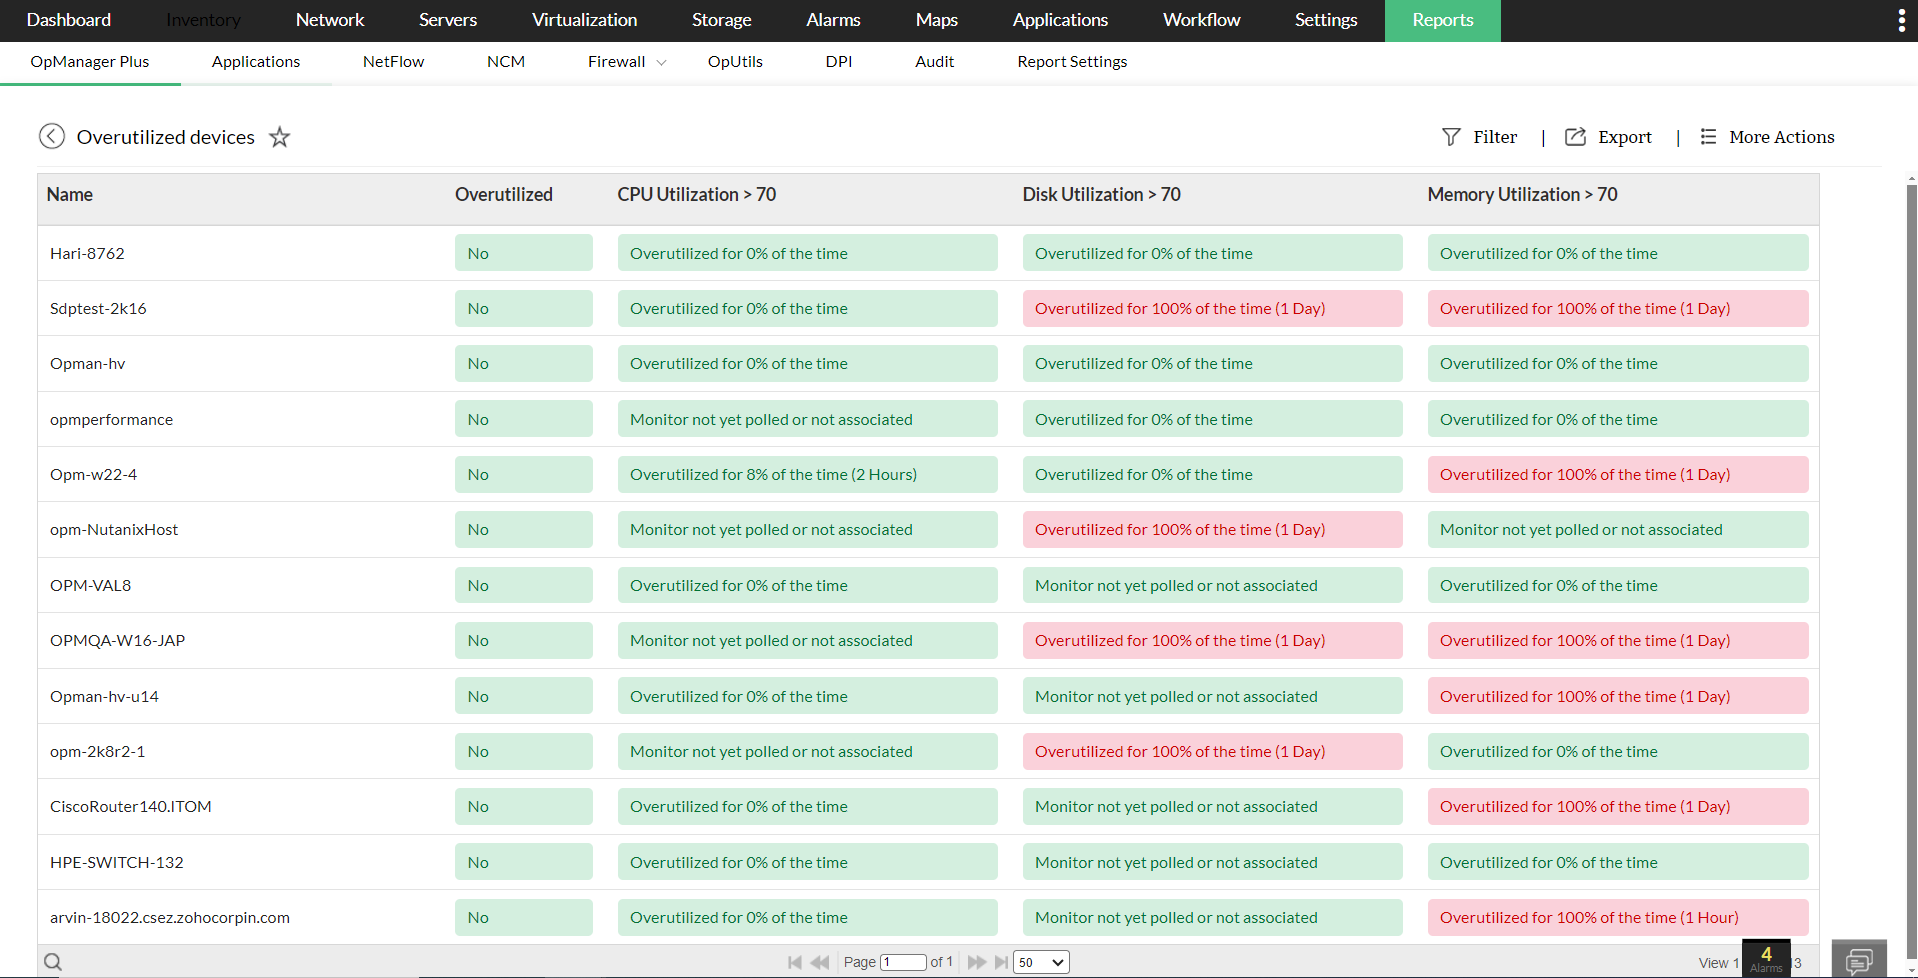
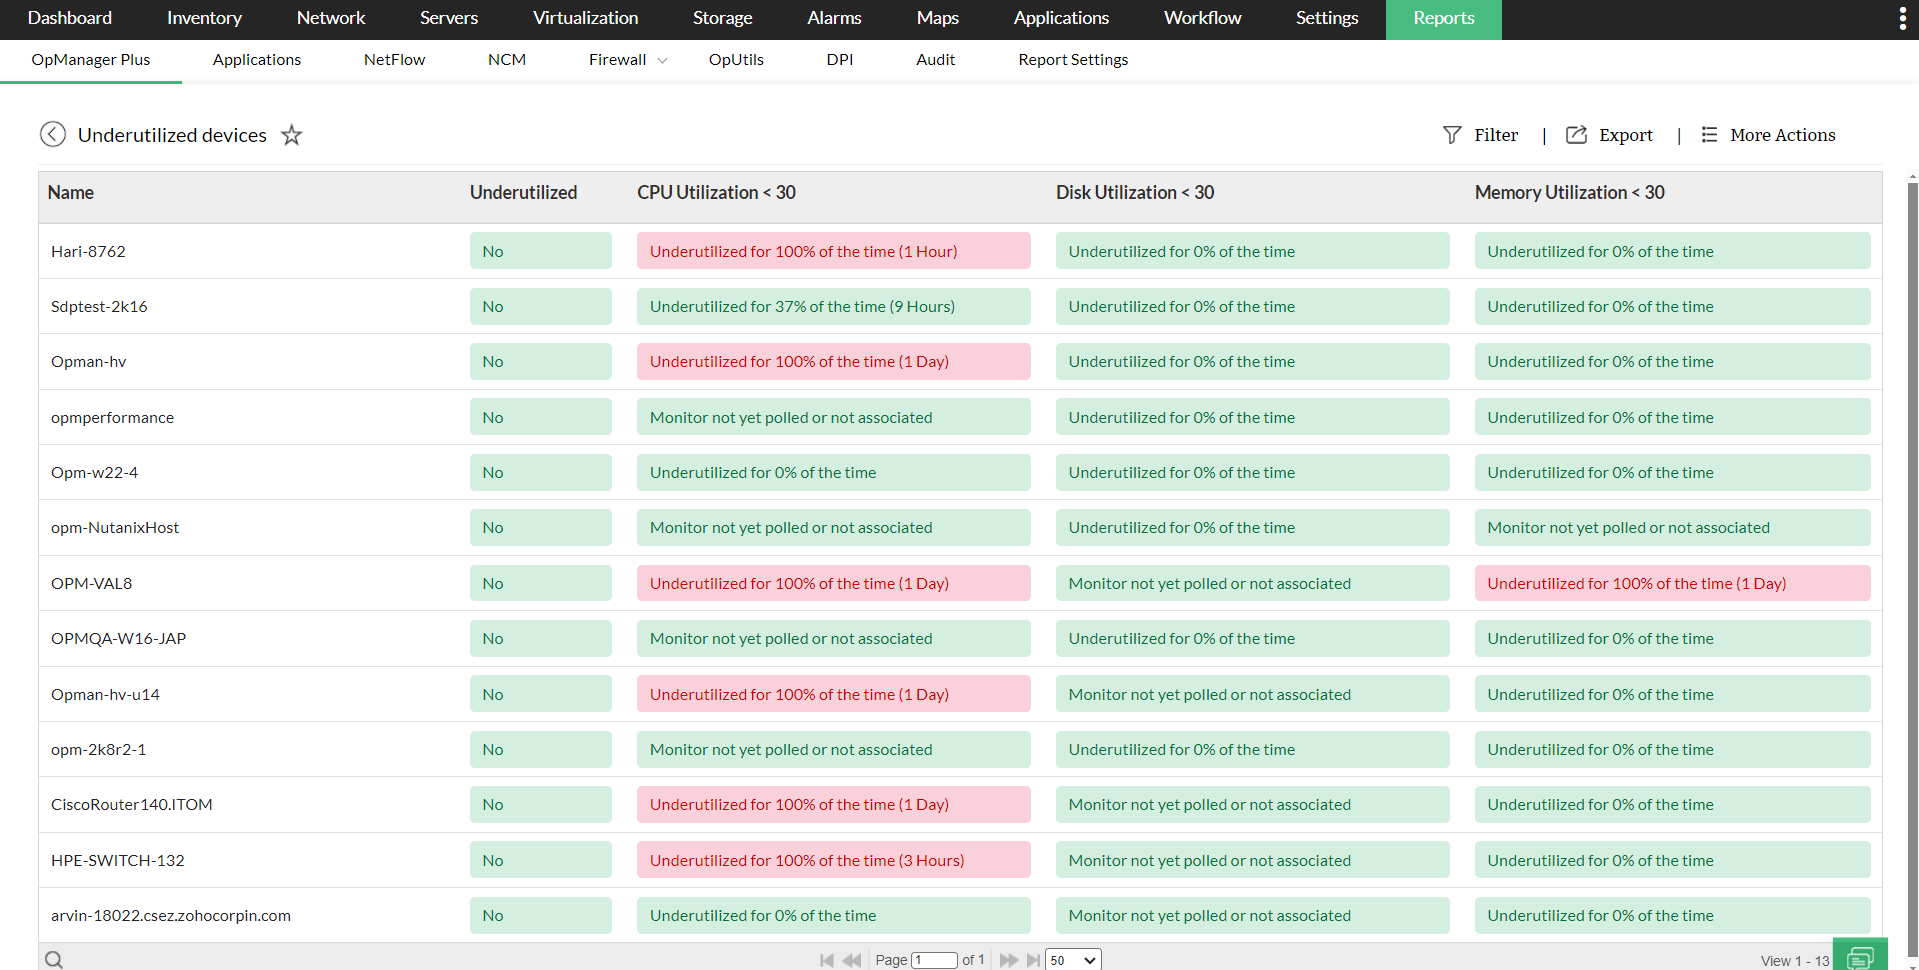
OpManager provides comprehensive capacity planning reports that track CPU, memory, storage trends over time. The reports give you visibility into the servers that are overutilized, underutilized and idle. This visibility enables your IT teams to reallocate resources for efficient operations or upgrade infrastructure resources before performance bottlenecks occur, ensuring that servers remain stable and responsive even during peak loads.
3. Leverage multi-vendor support
Modern IT infrastructures often include servers from different vendors and virtualized platforms as well. OpManager is vendor-agnostic server monitoring tool and supports virtual environments like Nutanix, Hyper-V, and Proxmox, giving a unified view of all servers. This centralized visibility helps IT teams detect and resolve issues across diverse systems quickly, reducing downtime and ensuring consistent uptime across the entire environment.
4. Visualize your server infrastructure with intuitive dashboards
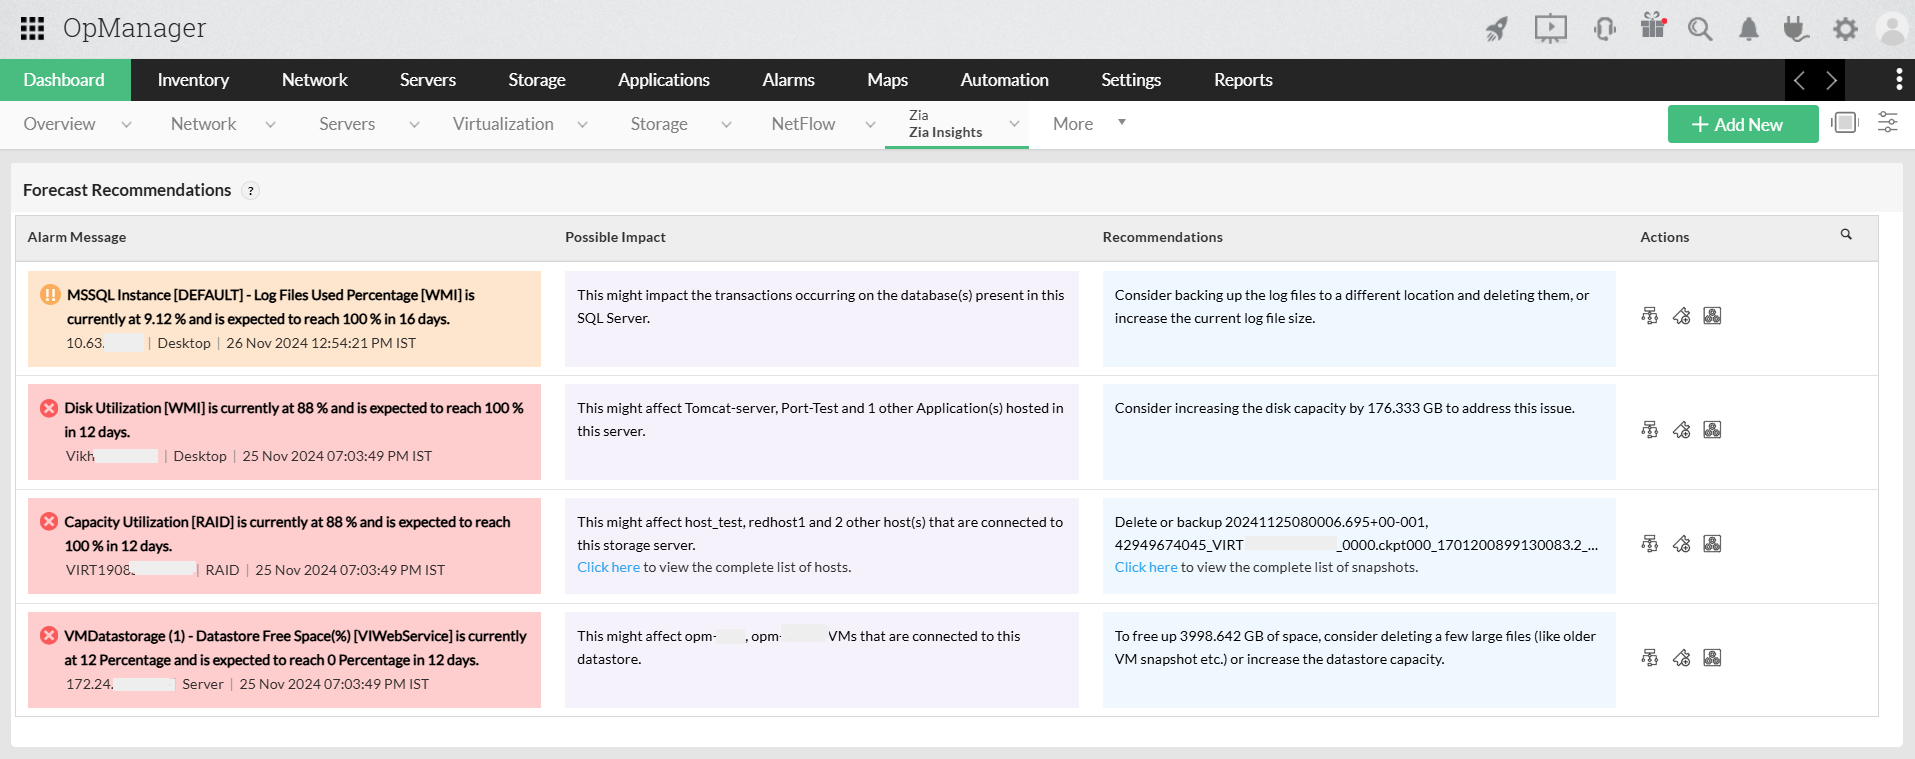
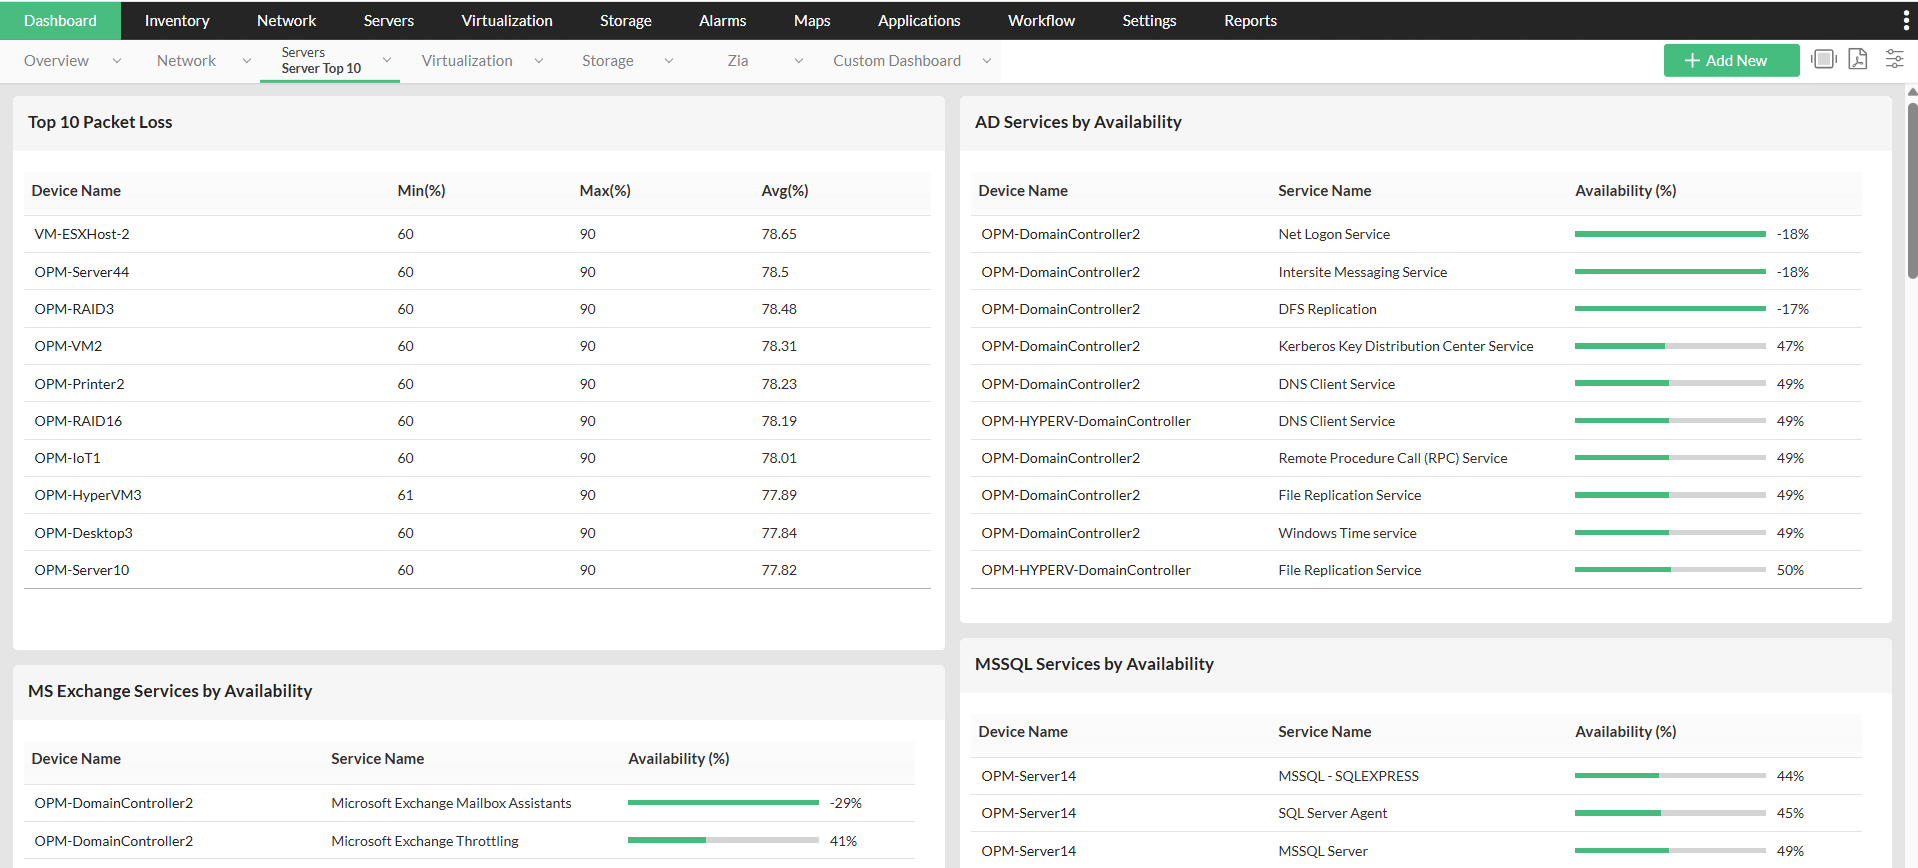
OpManager provides customizable dashboards that give IT teams a single-pane view of key server metrics, including performance metrics and availability. The dashboards with the integration of Zia (our AI assistant) are designed not just for a bird’s-eye overview but also for actionable insights. With Zia dashboards, IT teams gain AI-powered forecasting that predicts when critical resources—such as disk storage—will be fully utilized (e.g., “Disk will reach capacity in 12 days”). Alongside predictions, Zia also outlines the potential impact on server performance and recommends preventive measures, empowering admins to act before downtime occurs.
5 Get real time visibility of your server infrastructure with Rack Views and 3D Floor views
Beyond dashboards, OpManager enables teams to visualize their infrastructure with detailed Rack Views. These replicate the physical layout of racks, displaying the devices and components at each rack level. This visibility enables you detect the faulty element and guide the onsite technician to implement corrective actions. Rack Views can be combined to build 3D Floor Views, offering a holistic perspective of the entire data center. These floor-level visualizations map out racks and devices in real-world positions, helping IT teams monitor and manage data center operations more intuitively.

Maximize uptime and performance of your servers with OpManager
Download 30-day free trialTo learn more about these features and how it can help manage your network better, take a free personalized demo or try our product for yourself with our free edition.
FAQs
How can I forecast potential downtime?
+Why is monitoring server uptime important?
+Make your server uptime monitoring simple and efficient with OpManager
Download OpManager nowCustomer reviews
More than 1,000,000 IT admins trust ManageEngine ITOM solutions to monitor their IT infrastructure securely
Case Studies - OpManager
Awards & Honors
- Recognized as a May 2019 Gartner Peer Insights Customers' Choice for Network Performance Monitoring and Diagnostics Software
- Recognised as an April 2019 Gartner Peer Insights Customers' Choice for IT Infrastructure Monitoring Tools.
- Network Management and Monitor Vendor of the Year 2018, 2019
- Entered the 2019 Gartner NPMD Magic Quadrant.
- Ranked #2 in the Infotech Research Software Reviews Data Quadrant 2018.
R
