Proactive server monitoring with AI and ML
In today’s digital world, human-centric experience monitoring which is a combination of user experience (UX) and digital experience monitoring (DEM) is essential for businesses to thrive. The backbone of delivering high quality experience lies in the underlying IT infrastructure, particularly the servers that power the workloads. If servers experience downtime or performance degradation, it directly impacts DEM, leading to frustrated users, lost productivity, and potential revenue loss. To prevent such consequences it is important to establish a robust proactive server monitoring mechanism. On this page, we will discuss the following:
- Why do you need AI/ML for server monitoring?
- Why proactive monitoring matters?
- How AI and ML enables proactive server monitoring?
- OpManager's AI/ML capabilities
What is the need for AI and ML in server monitoring?
AI-powered server monitoring uses machine learning (ML) algorithms to analyze performance data, predict potential issues, and automate actions for incident response, transforming IT operations from a reactive to a proactive approach. To deliver superior digital experiences, automating server monitoring with Artificial Intelligence (AI) and Machine Learning (ML) is crucial.
Why proactive server monitoring matters?
Servers host business-critical data, applications, and services. A single server failure or slowdown can translate into:
- Poor user experience: Slow application response times or outages frustrate end-users and customers, severely damaging brand reputation.
- Business impact: Downtime can lead to lost sales, reduced employee productivity, and SLA breaches that attract hefty penalties.
- Increased costs: Reactive troubleshooting and manual interventions are time-consuming, resource-intensive, and can be expensive.
How AI and Machine Learning enable proactive server monitoring?
Today's network generates huge volumes of data, which becomes difficult to process and infer insights. AI and ML systems transform server monitoring by sifting through the large volumes of data and provide actionable insights that help you to anticipate problems and resolve issues before they affect the end-users. Key capabilities include:
1. Predictive analytics
- How it works: ML algorithms analyze historical and real-time server metrics (e.g., CPU, memory and disk usage) to forecast potential issues.
- Benefits: Predicts resource shortages, and enables efficient allocation of resources. Anticipates hardware failures, avoiding premature replacement costs.
2. Anomaly detection
- How it works: AI/ML systems establish a baseline of normal server behavior based on historical data and flag deviations, such as CPU spikes during non-working hours.
- Benefits: Identifies security threats, like malware or DDoS attacks. Raises alerts only for critical issues and reduces the alert noise.
3. Automated root cause analysis
- How it works: AI tools correlate data from logs, metrics, and events to identify the root cause of performance issues quickly.
- Benefits: Speeds up troubleshooting, minimizing downtime and the mean time to repair (MTTR). Reduces the manual effort of switching multiple tabs or tools for troubleshooting.
4. Automated remediation
- How it works: Modern monitoring tools integrate with automation tools to execute predefined actions, such as restarting services or scaling resources.
- Benefits: Automation significantly improves incident response by eliminating manual intervention and ensures applications run smoothly, enhancing user satisfaction.
5. Forecast trends and capacity planning
- How it works: Tools with ML capabilities analyze usage trends to recommend optimal resource allocation and infrastructure upgrades.
- Benefits: Prevents over-provisioning or under-provisioning, balancing the load on servers. Helps anticipate resource needs well before they are exhausted.
Ease into AI/ML-based server monitoring with OpManager
OpManager comes with built-in AIOps features, so that you need not invest on heavy customization or third-party add-ons. You also need not invest your valuable time and effort in learning the tool as it comes with an intuitive, easy-to-use UI. OpManager offers AI/ML capabilities in an affordable, easy-to-deploy package, ensuring businesses get proactive monitoring without overstretching budgets.
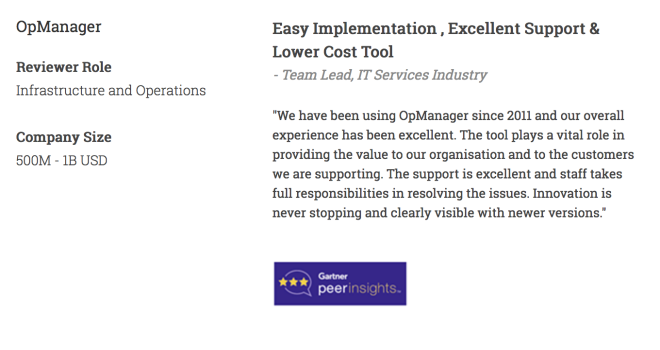
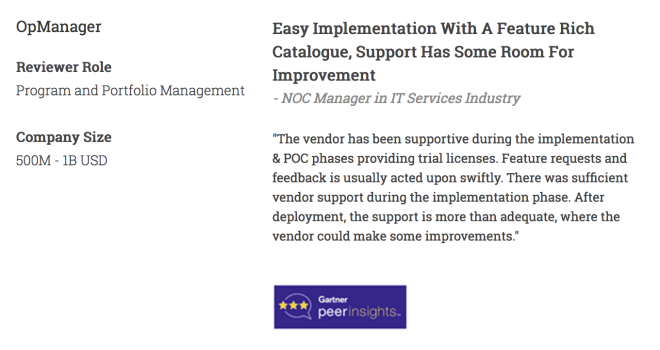
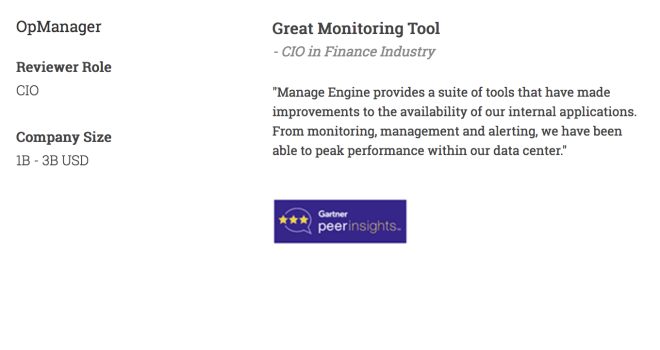
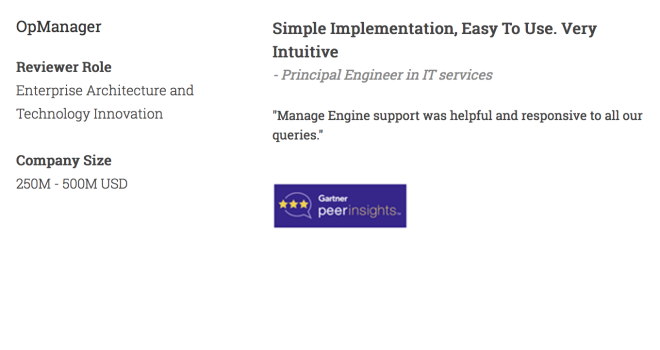
From our experience, it was plain sailing to roll out ManageEngine OpManager, and the licensing costs weren't prohibitive
Here are the AIOps features in OpManager that enable you transform server monitoring from reactive to proactive.
Adaptive Thresholds
OpManager’s adaptive thresholds use ML and learns from past usage trends and dynamically sets alert thresholds for key metrics like CPU Utilization, Memory Utilization, Disk Utilization, and bandwidth usage. The threshold levels are updated for every hour based on the trends. This reduces irrelevant alerts, enabling IT teams focus on actual anomalies and also ensures server performance issues are identified early, and minimizing disruptions.

Zia Chatbot
With the AI-powered Zia Chatbot you can get real-time server data with a single pre-defined prompt. It provides information like device health, status, and recently raised alarms. You can also perform simple troubleshooting actions like ping or traceroute using this option. The Zia Chatbot acts as your personal IT assistant and fetches the necessary information instantly and enables you to perform quick actions. This chatbot eliminates the manual effort of toggling multiple tabs, enables you to get what you need in seconds.

Zia Dashboard
Zia Dashboard leverages AI to predict server resource exhaustion. It analyzes trends to suggest proactive fixes, preventing slowdowns. This ensures servers scale with demand, maintaining optimal performance required to deliver superior digital experience to users.

Zia Insights
The Zia Insights option transforms performance data (available in graphs) into actionable summaries. Leveraging comparison and variance analysis it provides key insights useful for analysis. These insights help you easily detect anomalies, understand the performance and use that information to optimize servers, achieving consistent user experiences.

Organization map
OpManager’s Organization Maps provide a unified, real-time view of your entire IT infrastructure, visually mapping servers, routers, and critical business applications, enabling you to understand the whole picture. This holistic perspective makes it easier to identify issues, spot performance bottlenecks, and streamline network management, ensuring that administrators can monitor and manage everything efficiently from a single, intuitive interface.

Take a proactive approach to server monitoring with OpManager
Download 30-day free trialTo learn about how OpManager can help manage your network better, take a free personalized demo today.
FAQs on server monitoring tools
+Do I need AI expertise to use AI based tools?
How do AI and ML improve traditional server monitoring?
+Make your server uptime monitoring simple and efficient with OpManager
Download OpManager nowCustomer reviews
More than 1,000,000 IT admins trust ManageEngine ITOM solutions to monitor their IT infrastructure securely

Case Studies - OpManager
Awards & Honors
- Recognized as a May 2019 Gartner Peer Insights Customers' Choice for Network Performance Monitoring and Diagnostics Software
- Recognised as an April 2019 Gartner Peer Insights Customers' Choice for IT Infrastructure Monitoring Tools.
- Network Management and Monitor Vendor of the Year 2018, 2019
- Entered the 2019 Gartner NPMD Magic Quadrant.
- Ranked #2 in the Infotech Research Software Reviews Data Quadrant 2018.