Remote server monitoring involves monitoring and managing the availability, performance, health, and security of servers from a remote location by using dedicated tools. Organizations generally deploy remote server monitoring software which collects real-time data on metrics like memory usage, CPU utilization, disk space utilization, network traffic, application logs, and security events. The collected data is stored and often visualized in the form of reports, graphs, and dashboards. Remote server performance monitoring tools also raise alerts on potential server issues so that IT administrators and on-site technicians can swing into action and fix the issue.
Read on to learn more about remote server monitoring. Here is what you will find on this page.
In today’s digital world, servers are the backbone of business operations, powering applications, websites, databases, and other critical services. As these servers are often spread across different locations, ensuring their availability and performance requires an effective remote monitoring system. Remote monitoring has therefore become indispensable, offering businesses the visibility and control they need to keep operations running smoothly.
Implementing and maintaining remote server monitoring comes with its own set of hurdles. Some of the commonly noticed challenges are discussed below:
Network reliability and latency: Server monitoring requires a stable network connection, and issues like high latency, bandwidth bottlenecks, can affect data collection. Further, access to data on your servers can get impacted when the data centers are located in remote or rural areas, which are prone to connectivity blackouts.
Security and compliance risks: For remote monitoring, you often need to open firewall ports or install agents on the servers to gather data. This increases the attack surface and can serve as entry points for threat actors. Also, monitoring and performance data is usually transmitted over the network, and malicious actors can intercept the data if the channels are not encrypted. Any misconfigurations or vulnerabilities noticed on the agents could be exploited, affecting the server performance. Moreover, if the monitoring data is not handled properly, it could lead to non-compliance with industry regulations.
Data overload and alert fatigue: With servers generating massive amounts of data, the number of alerts raised will be indiscriminately high. Distinguishing the most critical issues from the noise requires filtering and intelligent AI-driven capabilities. If not, your teams may fail to address critical issues that can prove costly.
Scalability and operational complexity: As your business grows, the number of servers grows, so the monitoring tools must also scale without compromising on performance. In addition to this, budget constraints can be another hurdle. Sophisticated monitoring tools can be expensive, with separate licensing fee for each functionality, and small scale organizations can struggle due to the high upfront investment needed.
OpManager is an affordable, reliable remote server monitoring solution that fits businesses of all sizes. With OpManager you can manage your hybrid, distributed network infrastructure from a single console. Here are some of its key features.
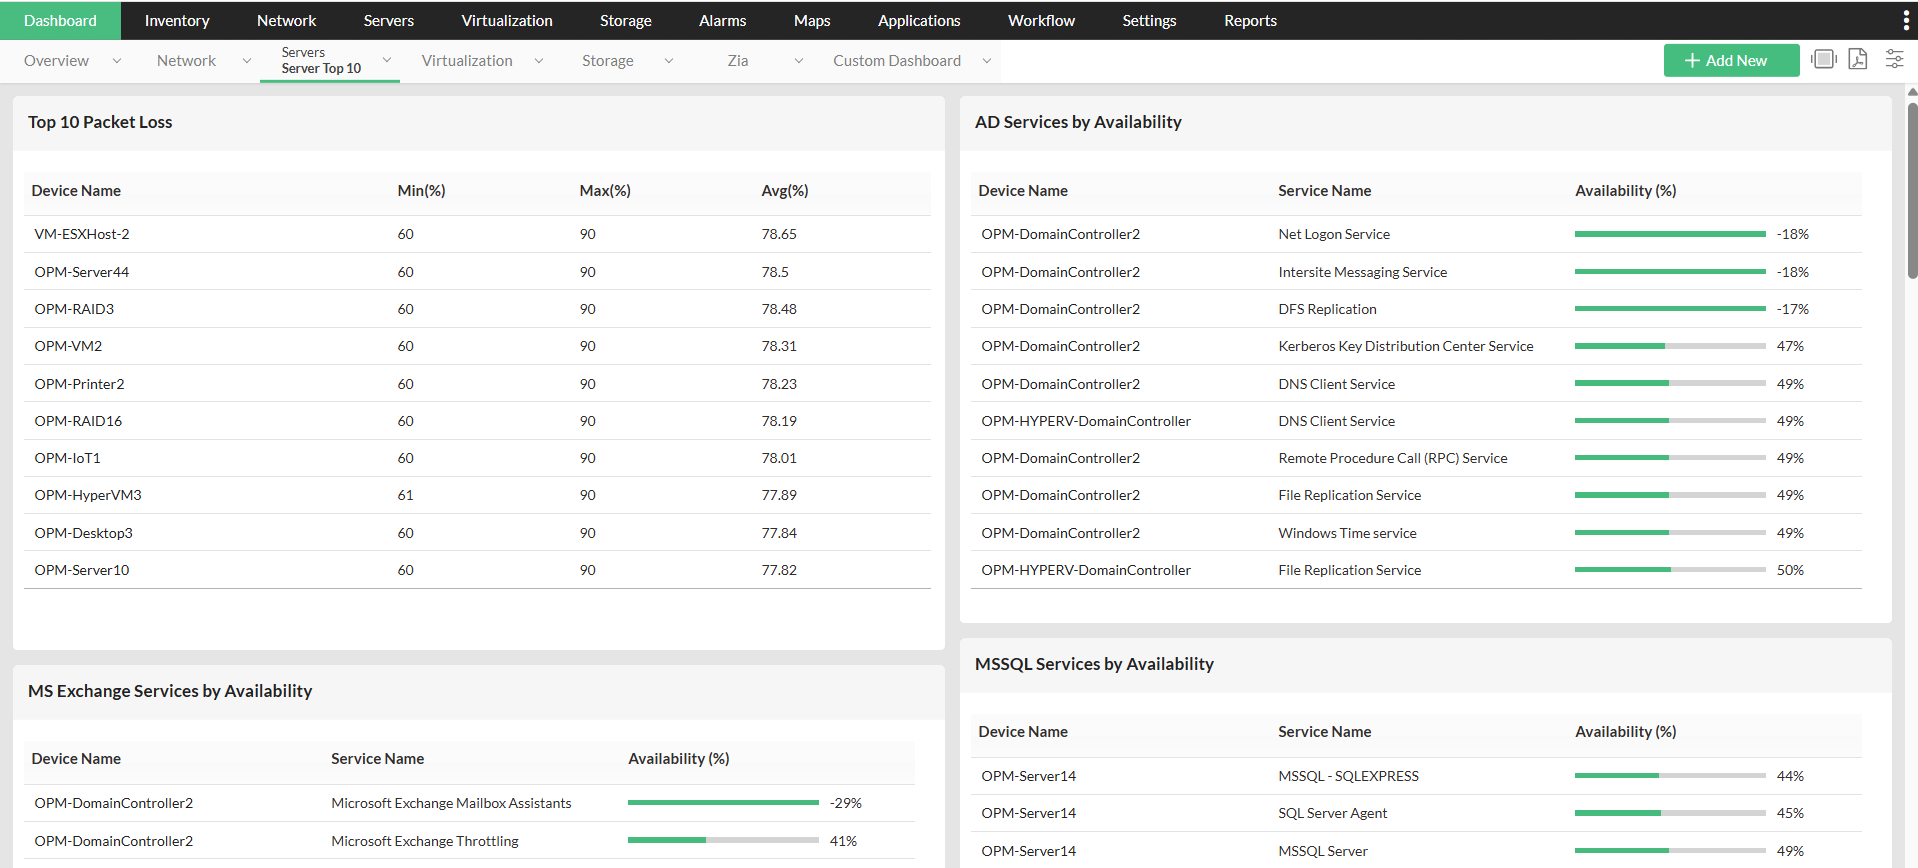
OpManager's Dashboard provides real-time insights into key server metrics, such as CPU, memory, disk utilization, and network performance. Customizable widgets provide actionable data, like top resource consumers, recent critical alerts raised, and server availability status report, enabling IT staff to identify bottlenecks from the network operations center and implement corrective actions.
OpManager offers agent-less monitoring, so that you do not have to install agents separately and can avoid the overhead. OpManager's powerful discovery rule engine automatically scans and adds all your devices/interfaces into its inventory. By default, it has 11000+ device templates and supports a wide range of vendors. You can also enable HTTPS in OpManager to ensure the data transmitted over the network is secure, preventing data interception by hackers.
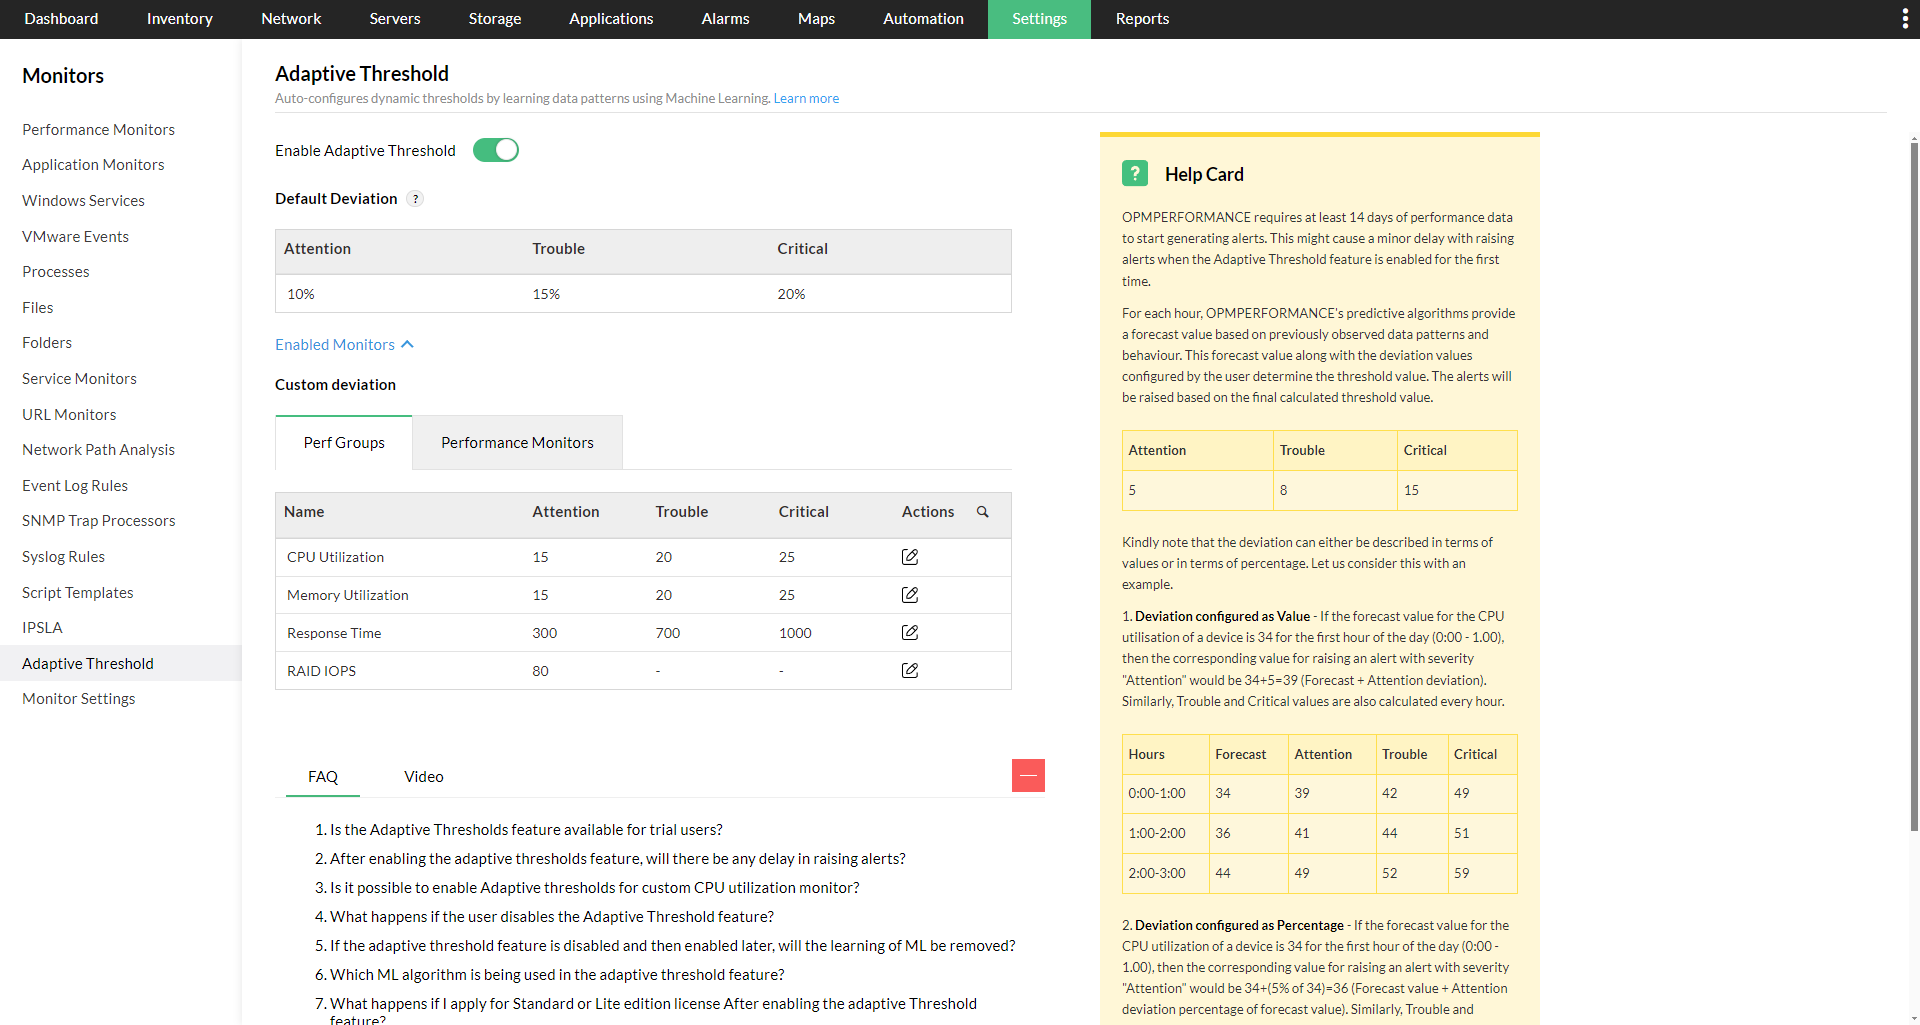
OpManager's adaptive threshold, its machine learning threshold configuration feature, dynamically sets alert thresholds based on past server behavior for critical metrics like CPU, disk and memory utilitzation. It learns from utilization trends and automatically sets the threshold value for each hour of the day. Thus, OpManager distinguishes the normal CPU spike from any unusual behaviour and raises alerts only when anomalies are detected. For example, OpManager will not raise an alert for a CPU spike during a Monday morning as it understands from historical trends that the spike is normal (because many users access the system during a weekday). But an alert will be raised when the same spike occurs during a weekend, or in the middle of the night, because the patterns show that it is unusual.
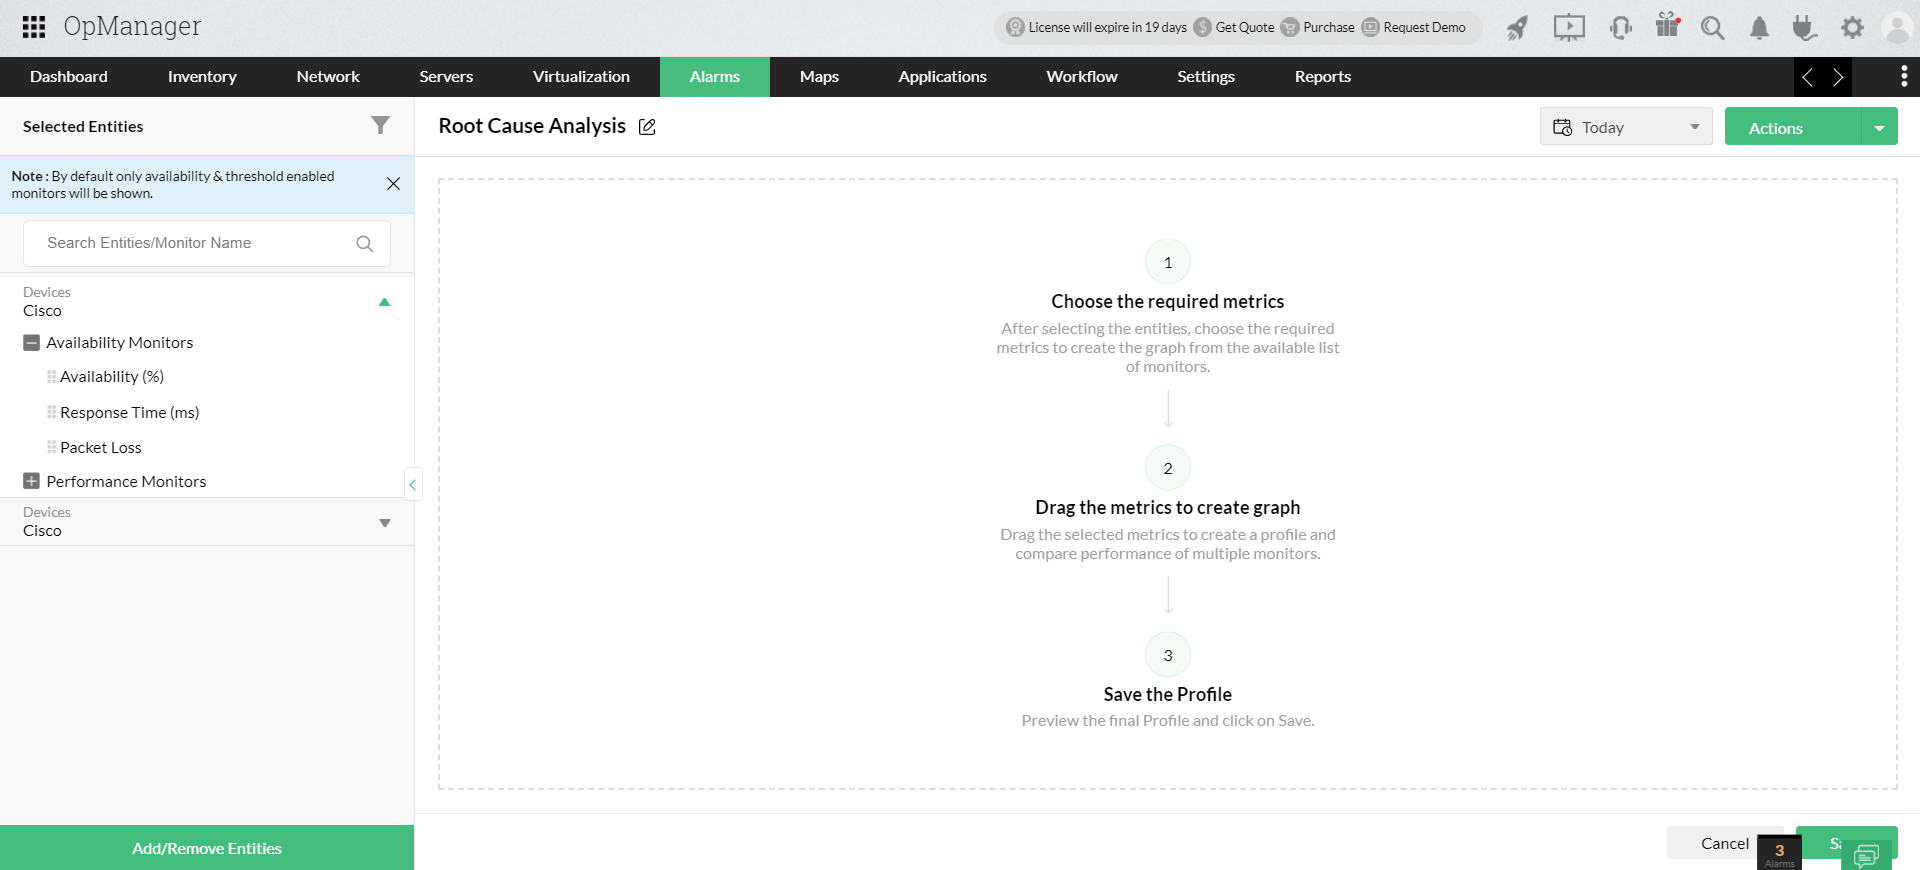
An IT downtime or performance degradation often leads to productivity loss and impacts user experience. The goal of any organization will be to reduce the troubleshooting time as low as possible, so that the systems are up and performing at its ideal level. RCA helps in troubleshooting by offering a graphical view of the performance and availability metrics of multiple entities like device, interfaces in a single window. This makes it easy to correlate, analyze and narrow down the root cause.
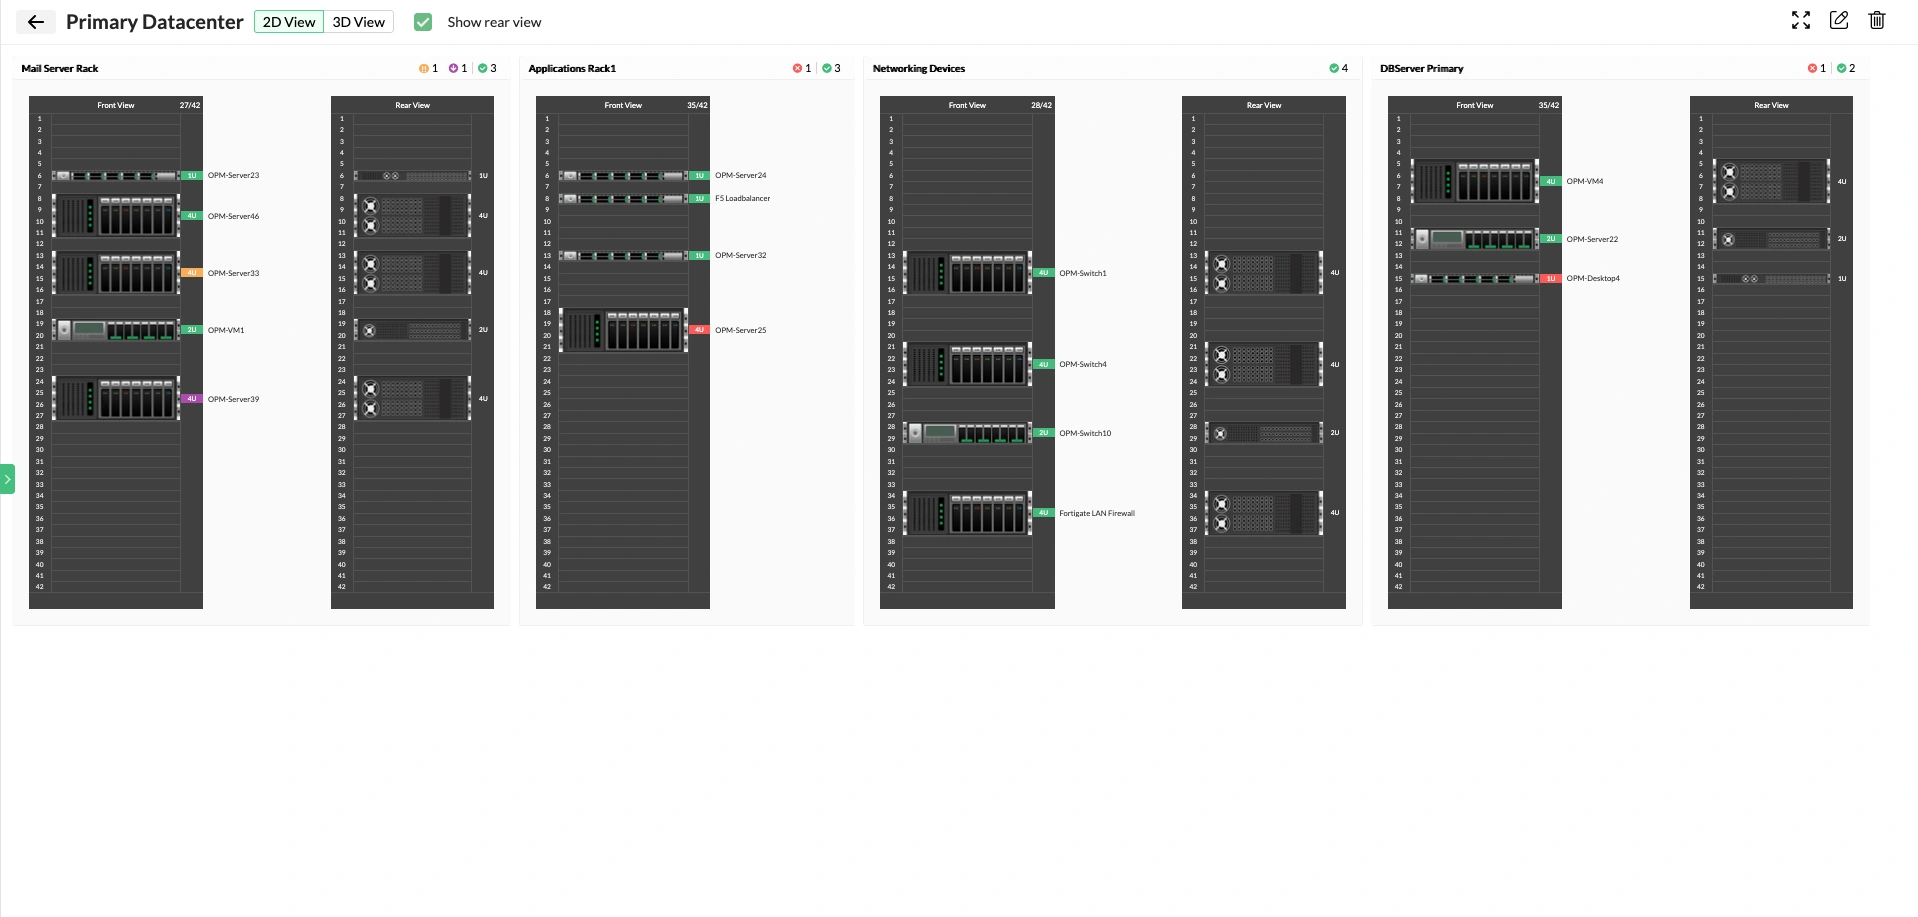
OpManager offers rack views which replicate the physical layout of server racks. In each rack you can see the device mounted on and its health status. For example, if the rack shows red colour, it indicates that the devices is faulty. This allows server teams to pinpoint issues precisely by locating the particular rack where the device is faulty and guide on-site technicians for quick resolution. 3D views provide a three-dimensional view of physical layout of the entire datacenter floor. Once the server rack view is created, you can drag and drop the racks to form a 3D view of the data center.
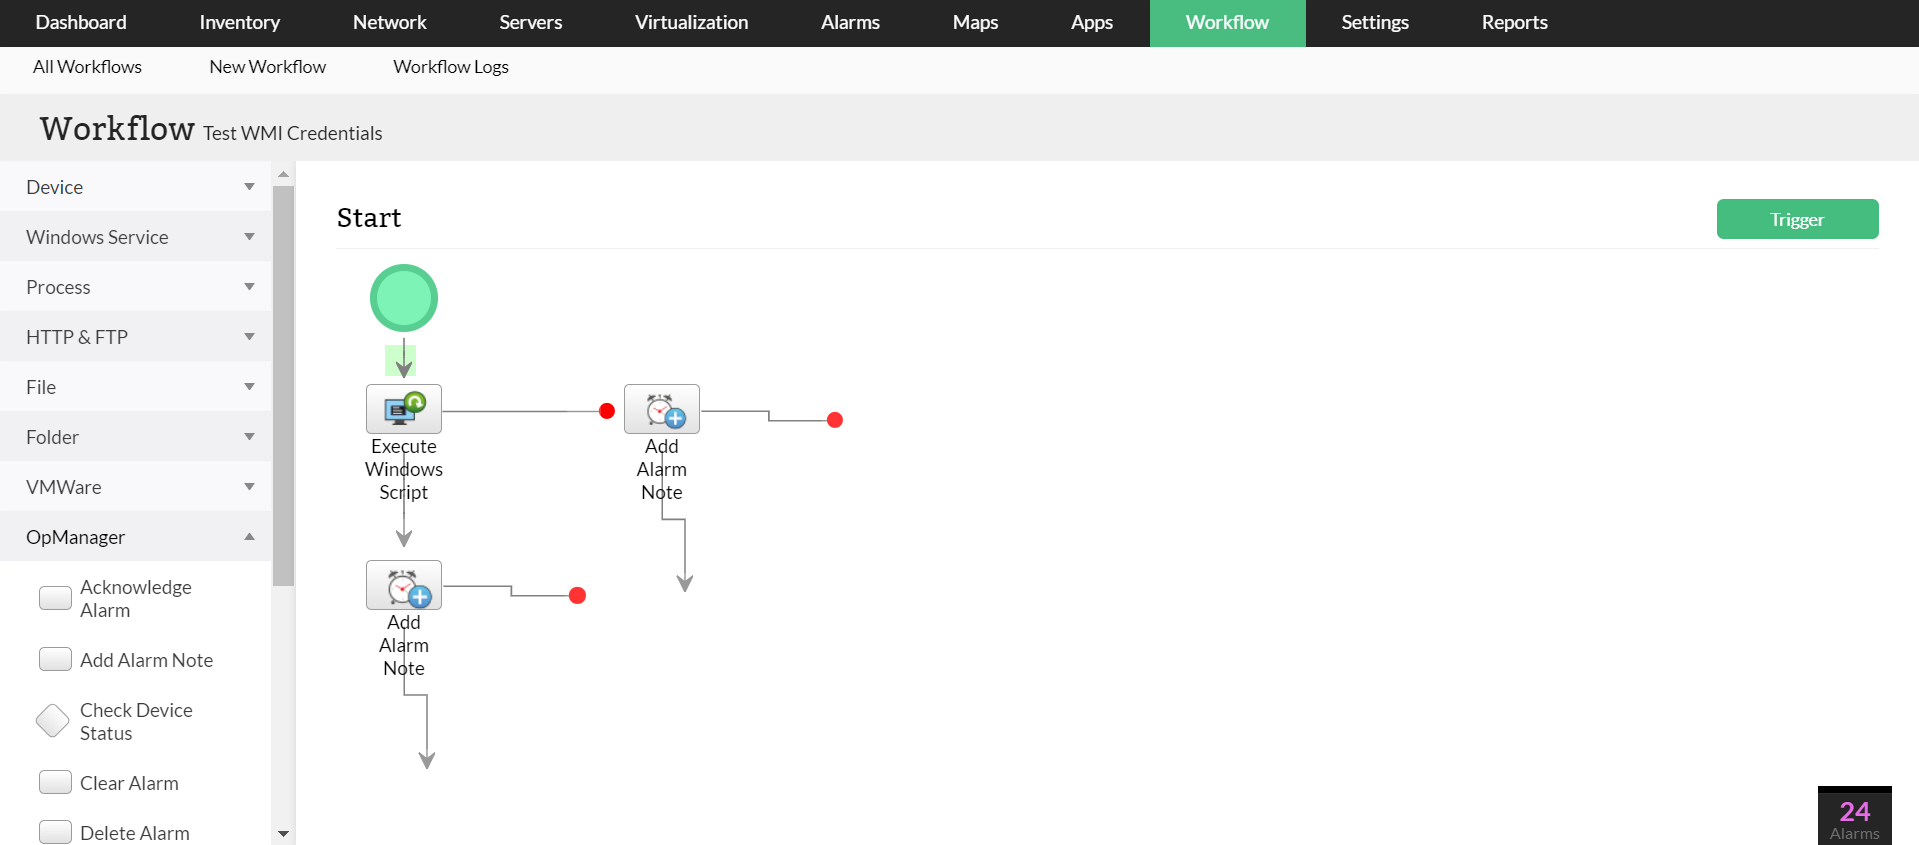
The workflow feature in OpManager automates routine tasks, such as restarting a service or logging a ticket. It is completely code-free and allows you to create custom workflows with the simple drag and drop approach. This reduces manual effort and accelerates issue resolution across the network infrastructure.
The health of your servers is integral for your business, and any downtime can directly impact productivity, revenue, and customer trust. Remote server monitoring is the need of the hour, especially with a hybrid distributed network.
With its centralized console, powerful monitoring features, and ease of use, OpManager helps you stay ahead of problems, optimize performance, and keep your servers running smoothly.
More than 1,000,000 IT admins trust ManageEngine ITOM solutions to monitor their IT infrastructure securely