Best practices for server monitoring: A 2025 guide to prevent downtime
Imagine a production server in a pharmaceutical manufacturing company slows down due to excessive CPU utilization. This seemingly minor issue translates into delayed batch production, halting the assembly line and pushing back the release of life-saving medications. It could also lead to non-compliance with industry regulations and breach SLAs with suppliers and distributors. Further, it can cause reputational damage and erode the trust healthcare providers have in the organization. Regardless of the industry, one fact remains constant: the health of your servers is integral to the health of your business. On this page, we will discuss the following:
- What is server monitoring?
- Best practices in server monitoring
- How OpManager ensures the health of your servers?
What is server monitoring?
Server performs diverse functions. For example, a webserver hosts the website, an application server runs business critical applications, a database server holds valuable information. Server monitoring is the process of methodically monitoring the availability and key performance indicators of the servers to ensure the seamless delivery of services and the smooth functioning of workloads that depend on them.
7 essential server monitoring best practices
Server monitoring is more than just tracking CPU, memory, and disk usage. It involves monitoring the associated applications, services, logs, and even containerized or cloud environments. Here are some of the best practices for monitoring your servers:
1. Monitor underlying infrastructure
Keep a close eye on the most foundational aspects for the functioning of the server: the associated hardware (cooling and power systems), network connectivity, and availability. Then, keep track of metrics like CPU utilization, memory usage, disk I/O. The underlying infrastructure is crucial, and by monitoring it you can detect performance bottlenecks or hardware failures well before they cause a server crash or slows down the server.
2. Monitor dependent workloads
Servers support the functioning of a wide range of applications and services that are crucial to business operations, hence focusing on the performance of the dependent workloads is essential.:
- Applications: Monitoring the performance of your applications is integral to your business. So, continuously track availability, response time, error rates, and resource usage to ensure applications deliver as expected. This will allow you to identify bottlenecks, slowdowns, or failures that could directly affect the end-user experience.
- Services: Services running in your network deliver critical functions. For example, FTP for file transfer, SMTP for email delivery. So, to avoid productivity loss, monitor critical services running in your network such as DNS, LDAP, Telnet, FTP, SMTP, IMAP, NNTP, and Echo.
3. Centralize and analyze server logs
Server logs contain valuable information such as system events, errors, authentication failures, which will serve useful during troubleshooting performance issues or security incidents. Regular server log monitoring helps detect application issues, and understand usage patterns. Consider using a log monitoring tool to centralize logs from multiple servers into a single dashboard to make analysis and correlation far easier.
4. Track resource usage
As business demand increases, applications and services place additional load, potentially straining the servers. By analyzing usage trends, you can anticipate spikes in customer traffic or transactions and proactively plan resource expansion. Modern server performance monitoring tools, powered by AI and ML, leverage historical data to forecast future resource utilization. Forecast reports indicate when critical resources such as CPU, memory, or storage are likely to reach certain levels like 80%, 90% and 100%, enabling you to predict and seamlessly scale up resources to meet the rising demand.
5. Monitor your containers and cloud environments
Modern applications often run in containerized environments or on cloud infrastructure. Monitor container health by tracking metrics like CPU utilization, memory consumption, network throughput, disk I/O operations. Also monitor the network traffic to optimize bandwidth. Leverage a unified solution that supports major cloud vendors like GCP, Azure and AWS, to ensure the performance of your cloud based workloads. This ensures that both on-premises and cloud workloads perform seamlessly.
6. Leverage Automation with AI/ML
Automation simplifies monitoring by reducing alert noise and implementing remediation to faults. AI and ML can enhance automation by detecting patterns, predicting failures, and recommending corrective actions. Automated workflows can trigger alerts, restart services, or scale resources proactively, reducing human error, speeding up response times, and maintaining consistent performance.
7. Prioritize what needs to be monitored
The key performance indicators to monitor will vary for each organization. While some are universal across environments, others are specific to applications or workloads. Here’s a breakdown of the key metrics across different layers:
| Metric | Why it matters |
|---|---|
| Availability | Indicates that the servers are up and running, essential for business continuity. |
| CPU / Memory / Disk Usage | Critical resources that power the workload. |
| Container Instance Count & Churn | Tracks container stability; high churn may indicate configuration or scaling issues. |
| Application Latency & Response Time | High latency or response time directly affects digital user experience. |
| Requests per Second / Throughput | Measures the load placed on servers. |
| Error Rate | Identifies failures in transactions or processes; early warning of deeper issues. |
| Thread Count & Memory Consumption | Detects bottlenecks in multi-threaded applications; prevents resource exhaustion. |
| JVM (GC & Heap) | Critical for Java-based apps. |
How these best practices impact ROI?
The value of implementing these practices has far-reaching benefits, safeguarding revenue and ensuring operational continuity. For example, a leading pharmaceutical manufacturer ensured the health of its production servers, network connectivity and other critical systems like BMS, PLCs with the help of OpManager. By proactive monitoring, it prevented batch failures or workflow disruptions, and the company was able to avoid losses amounting to nearly $1 million. This case study shows how implementing industy-wide best practices translates into tangible financial savings.
Implement best-in-class server monitoring with OpManager
ManageEngine OpManager is vendor-agnostic server monitoring solution that supports a wide range of environments, including virtual servers like VMware and Hyper-V, allowing you to manage your entire datacenter from a single console. With a dedicated real-time dashboards for servers, instant alerts, AI/ML-driven graphs and reports, OpManager simplifies server monitoring, improves operational efficiency, and helps you achieve your business goals.
Get a first hand experience of OpManager's server monitoring features
Download 30-day free trialTo learn more about these features and how it can help manage your network better, take a free personalized demo or try our product for yourself with our free edition.
FAQs on Server Monitoring
How frequent should servers be monitored?
+Can server monitoring help ensure security?
+Make your server uptime monitoring simple and efficient with OpManager
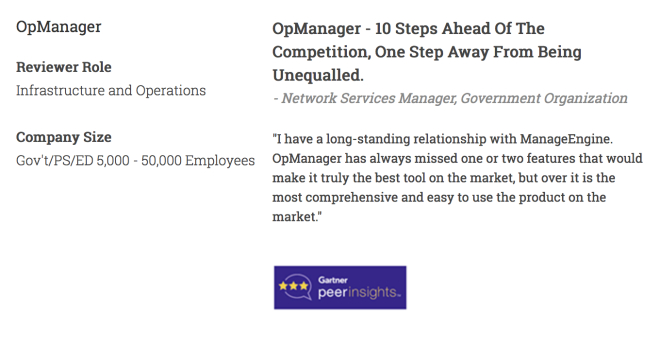
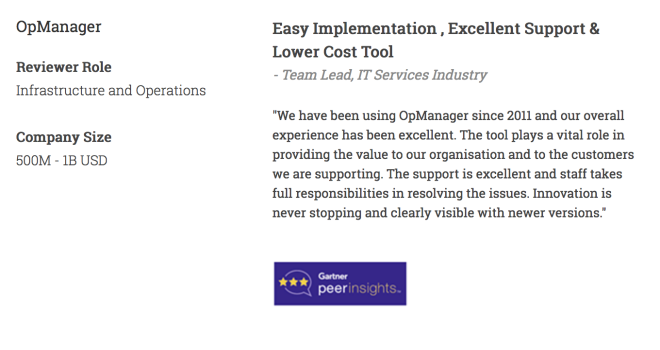
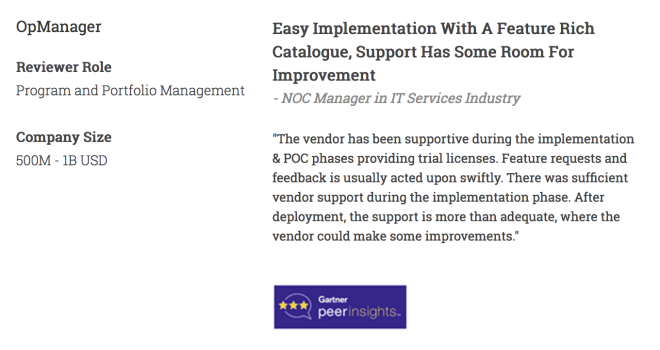
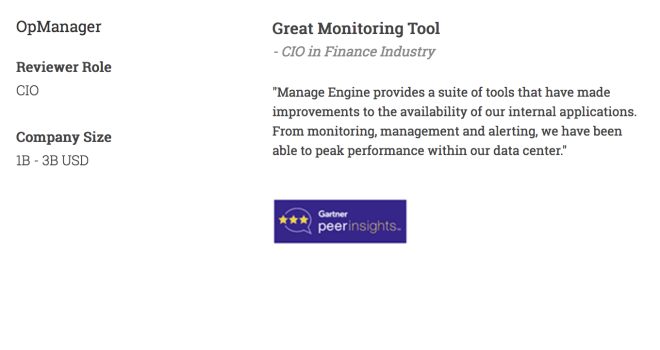
Download OpManager nowCustomer reviews
More than 1,000,000 IT admins trust ManageEngine ITOM solutions to monitor their IT infrastructure securely
Case Studies - OpManager
Awards & Honors
- Recognized as a May 2019 Gartner Peer Insights Customers' Choice for Network Performance Monitoring and Diagnostics Software
- Recognised as an April 2019 Gartner Peer Insights Customers' Choice for IT Infrastructure Monitoring Tools.
- Network Management and Monitor Vendor of the Year 2018, 2019
- Entered the 2019 Gartner NPMD Magic Quadrant.
- Ranked #2 in the Infotech Research Software Reviews Data Quadrant 2018.
R
