Servers host business-critical applications, databases, and services. To ensure uninterrupted performance and prevent costly downtime, IT teams should monitor the performance of servers. Monitoring the key performance metrics of servers enables server teams to detect issues proactively, optimize resource allocation, and ensure security. On this page, we will discuss the following topics:
Server health metrics are specific, quantifiable data points such as CPU usage, memory consumption, and disk I/O that are continuously tracked to assess the performance, availability, and operational status of a server.
Monitoring provides real-time visibility and provides other key benefits which include:
In the following section we have given the key performance metrics for servers. These metrics can be grouped into two categories: core resource usage metrics and related metrics that cover security and hardware health aspects. Together, these provide a complete view of server health and performance.
| Metrics | Description | Why should you monitor? |
|---|---|---|
| CPU Usage | Percentage of CPU capacity in use (e.g., per core or overall). | Consistent high usage indicates overload from processes, potentially leading to slowdowns. |
| Memory Usage | Amount of RAM consumed (total, used, free, swap). | Frequent memory leaks or high demand can cause swapping, which degrades performance. |
| Disk I/O & Space | Read/write rates and available storage space. | Full disks or slow I/O can halt regular operations. |
| Throughput | Inbound/outbound traffic volume and bandwidth usage. | Helps optimize bandwidth and ensure critical applications get necessary resources. |
| Metric | Description | Why Monitor? |
|---|---|---|
| Log Volume & Errors | Number of entries, warnings, and critical errors in server/application logs. | Unusual patterns reveal security breaches or failures. |
| Hardware Metrics (Fan) | CPU, disk, and ambient temperatures. | Overheating leads to throttling or hardware failure. |
It is important to understand the usage levels of each server and define the thresholds for CPU, memory, and disk. The exact threshold values may differ depending on the network environment and workload. However, we have given below the recommended thresholds for these critical metrics.
| Metric | Warning/Critical Thresholds |
|---|---|
| CPU Usage | > 80% (Sustained) / > 95% |
| Memory Usage | > 85% / > 95% |
| Disk Space | < 20% Free / < 10% Free |
While a server monitoring tool automates and simplifies the monitoring process, you can perform quick spot-checks using built-in OS utilities:
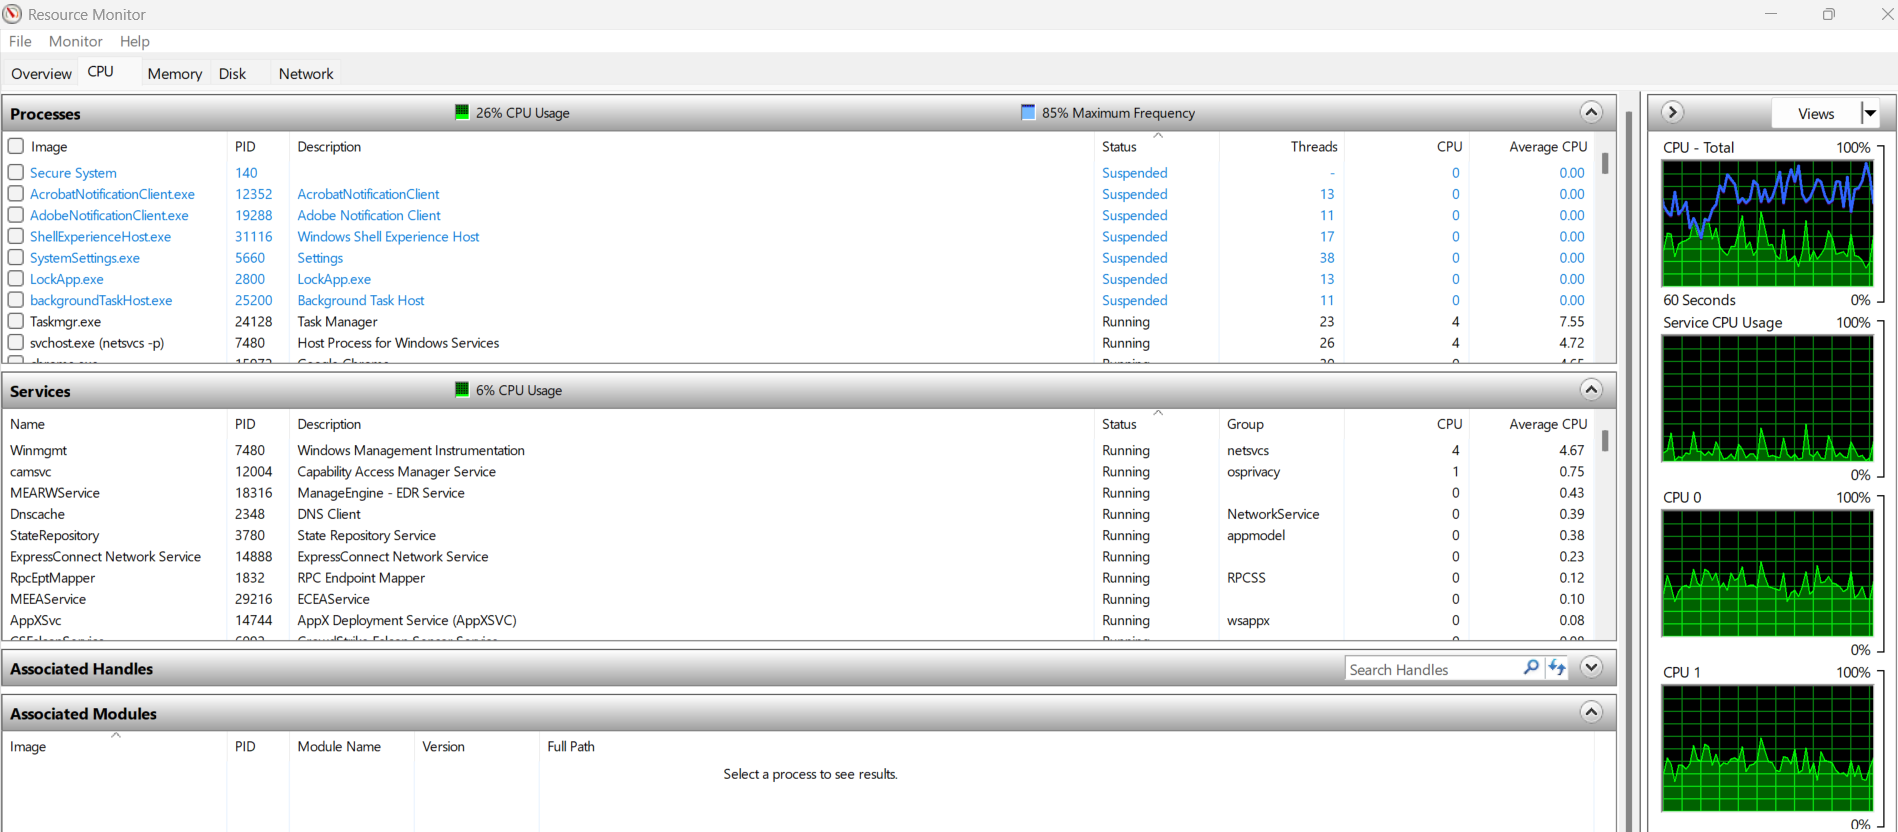
On Windows: Use the Resource Monitor (resmon) to view real-time graphs for CPU, Memory, and Disk I/O.

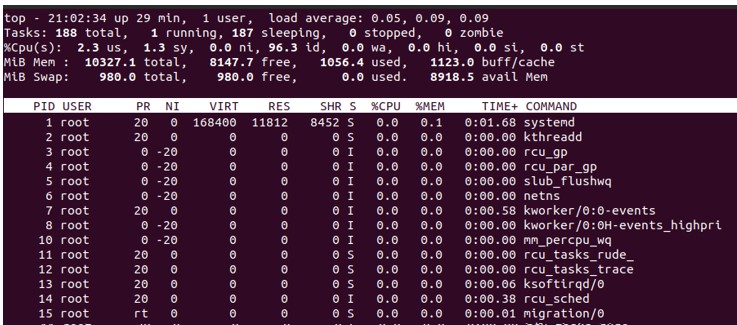
On Linux: Use common command-line tools like top or htop for live CPU and memory usage, df -h to check disk space, and iostat for disk I/O statistics.

Knowing what to monitor (the metrics) is a good starting point, but the real impact comes from how you approach the monitoring process. That’s where industry-wide best practices come into play. By following proven best practices, IT teams can move beyond reactive monitoring and adopt a more proactive, structured strategy that not only prevents downtime but also optimizes performance. We’ll look at some of these tried-and-tested methods that you can implement to establish a robust server monitoring mechanism.
Based on the historical data and usage trends define normal operating ranges or thresholds for CPU, memory, disk, and bandwidth utilization. This enables you discern between normal workload spikes and actual anomalies.
Alert fatigue is a huge challenge often faced by IT teams. To avoid this, leverage AI/ML based tools and configure dynamic thresholds (based on the usage). This will help you prioritize critical alerts and prevent alert fatigue. Further, institute escalation policies to ensure the right teams act promptly, if critical alerts are left unattended.
It is important to correlate server health with other layers of the IT stack like application performance, network traffic. This provides context and greatly helps in finding the root cause of an issue.
By automating routine tasks such as restarting a failed process, ensures that recurring issues are addressed instantly without waiting for human intervention. This not only accelerates recovery times but also frees up IT teams to focus on more strategic initiatives instead of repetitive firefighting.
Traditional monitoring tells you what went wrong, but predictive analytics tells you what might go wrong. By using AI/ML-powered monitoring tools, IT teams can forecast potential issues such as storage exhaustion, CPU saturation, or memory leaks before they impact end users. This proactive approach helps businesses stay ahead of problems, reduce downtime, and ensure optimal server performance always.
Regularly patching operating systems, updating firmware, and testing backup systems significantly reduces vulnerabilities and ensures business continuity. Maintenance activities act as preventive care for servers, minimizing the risk of sudden failures or security breaches.
In today’s hybrid IT environments, servers can span across on-premises data centers, cloud providers, and virtualized infrastructures. Depending on dedicated tools to monitor each system only leads to tool sprawl, and data compartmentalization. By relying on a unified platform you can eliminates these silos, and get end-to-end visibility from a single pane of glass. This holistic view makes it easier to correlate performance data, streamline alert management, and identify the root cause of issues faster.
Effective server monitoring is more than just tracking uptime—it’s about gaining complete visibility, optimizing performance, and proactively managing your infrastructure. OpManager provides a unified platform that empowers IT teams to monitor servers in real time, predict potential issues, and take immediate action to ensure maximum uptime and efficiency.
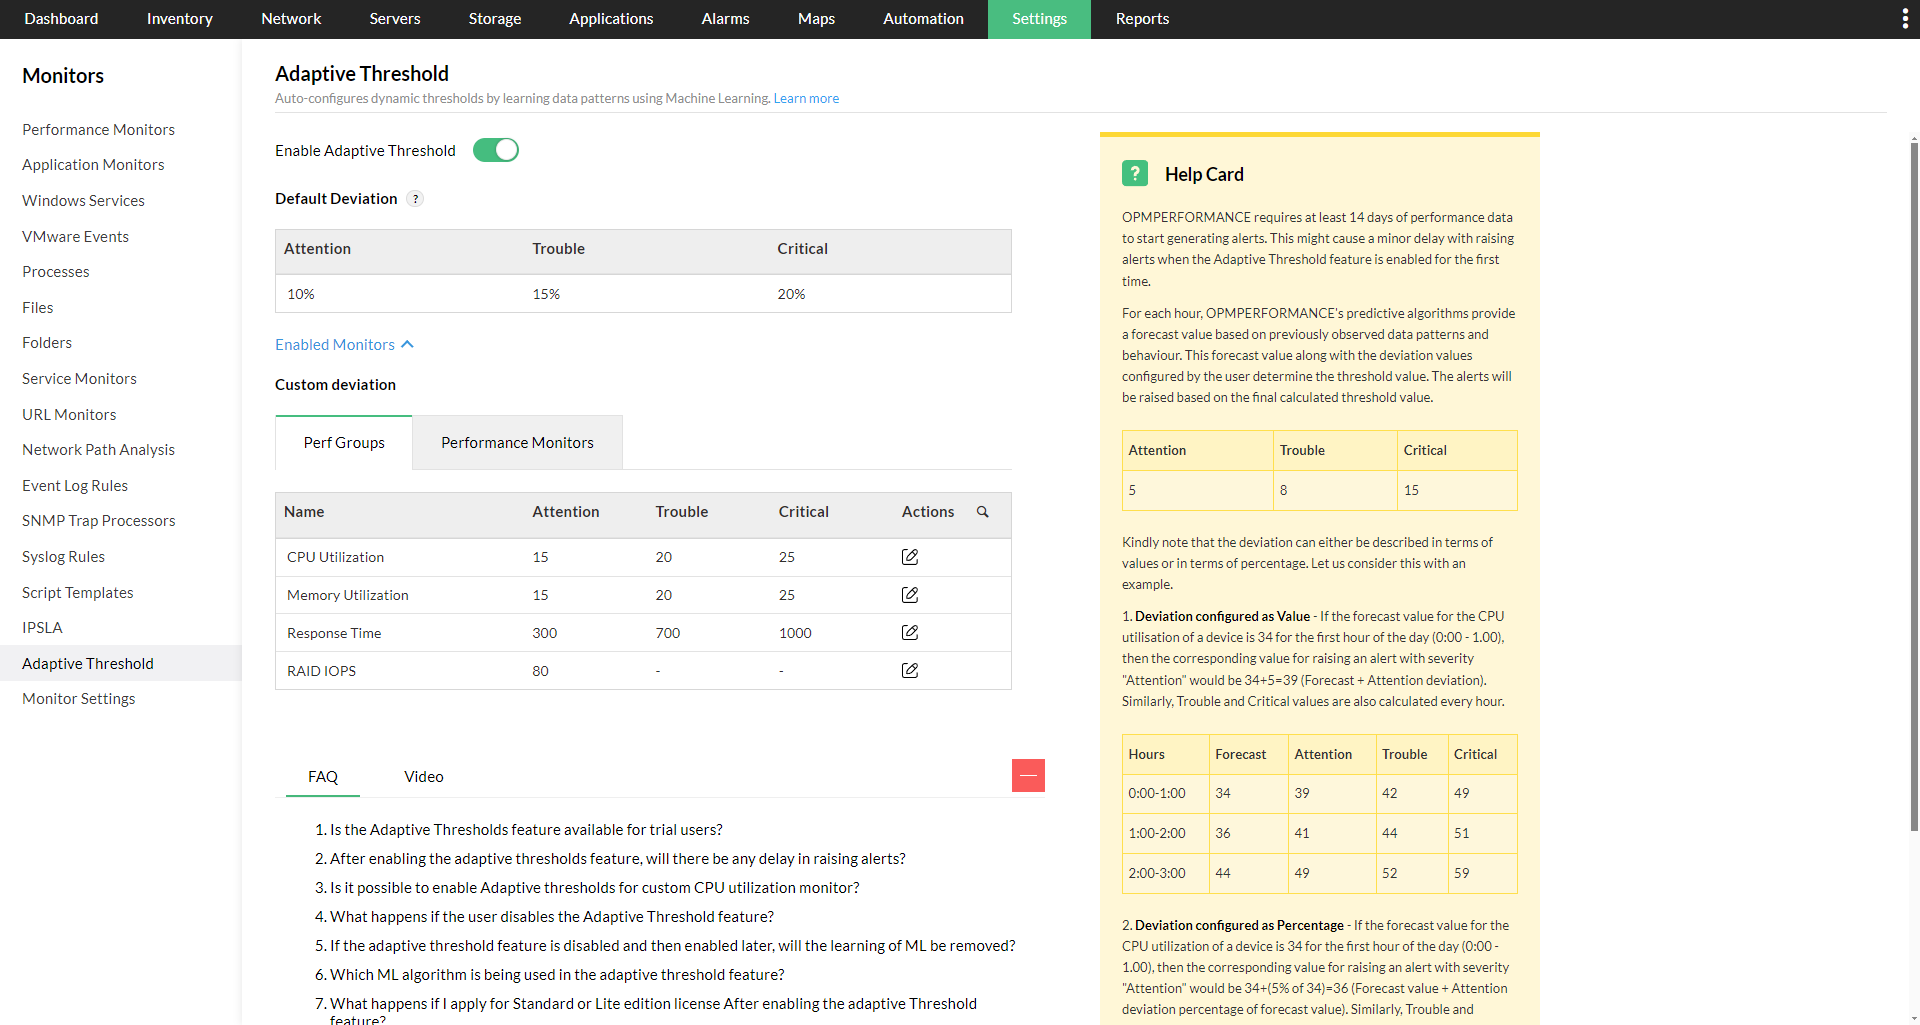
Keeping servers online is critical for business continuity, and OpManager takes uptime monitoring a step further with adaptive thresholds powered by machine learning(ML). Instead of static limits, thresholds are dynamically adjusted for each server based on historical patterns and real-time behavior. Whenever a metric breaches its adaptive threshold, IT teams are alerted instantly, allowing them to proactively address issues before they impact users. This intelligent, proactive approach maximizes uptime, minimizes service disruptions, and ensures your infrastructure runs smoothly around the clock.

OpManager tracks critical metrics such as CPU, memory, disk, and network usage. With the built-in capacity planning reports you can view the overutilized, underutilized and idle servers helping IT teams optimize resource allocation and balance workloads effectively. Furthermore, the OpManager leverages ML and provides forecasting graphs that predict future server usage trends, enabling proactive planning and preventing potential bottlenecks before they affect performance. This combination of real-time monitoring and predictive analytics ensures your infrastructure stays efficient and scalable.
For large server farms, visualizing your infrastructure is essential. OpManager provides intuitive rack-level views and 3D floor mapping, allowing IT teams to see physical server placement, connectivity, power usage, and temperature at a glance. This visual representation simplifies troubleshooting, improves operational efficiency, and makes managing complex data centers much easier.

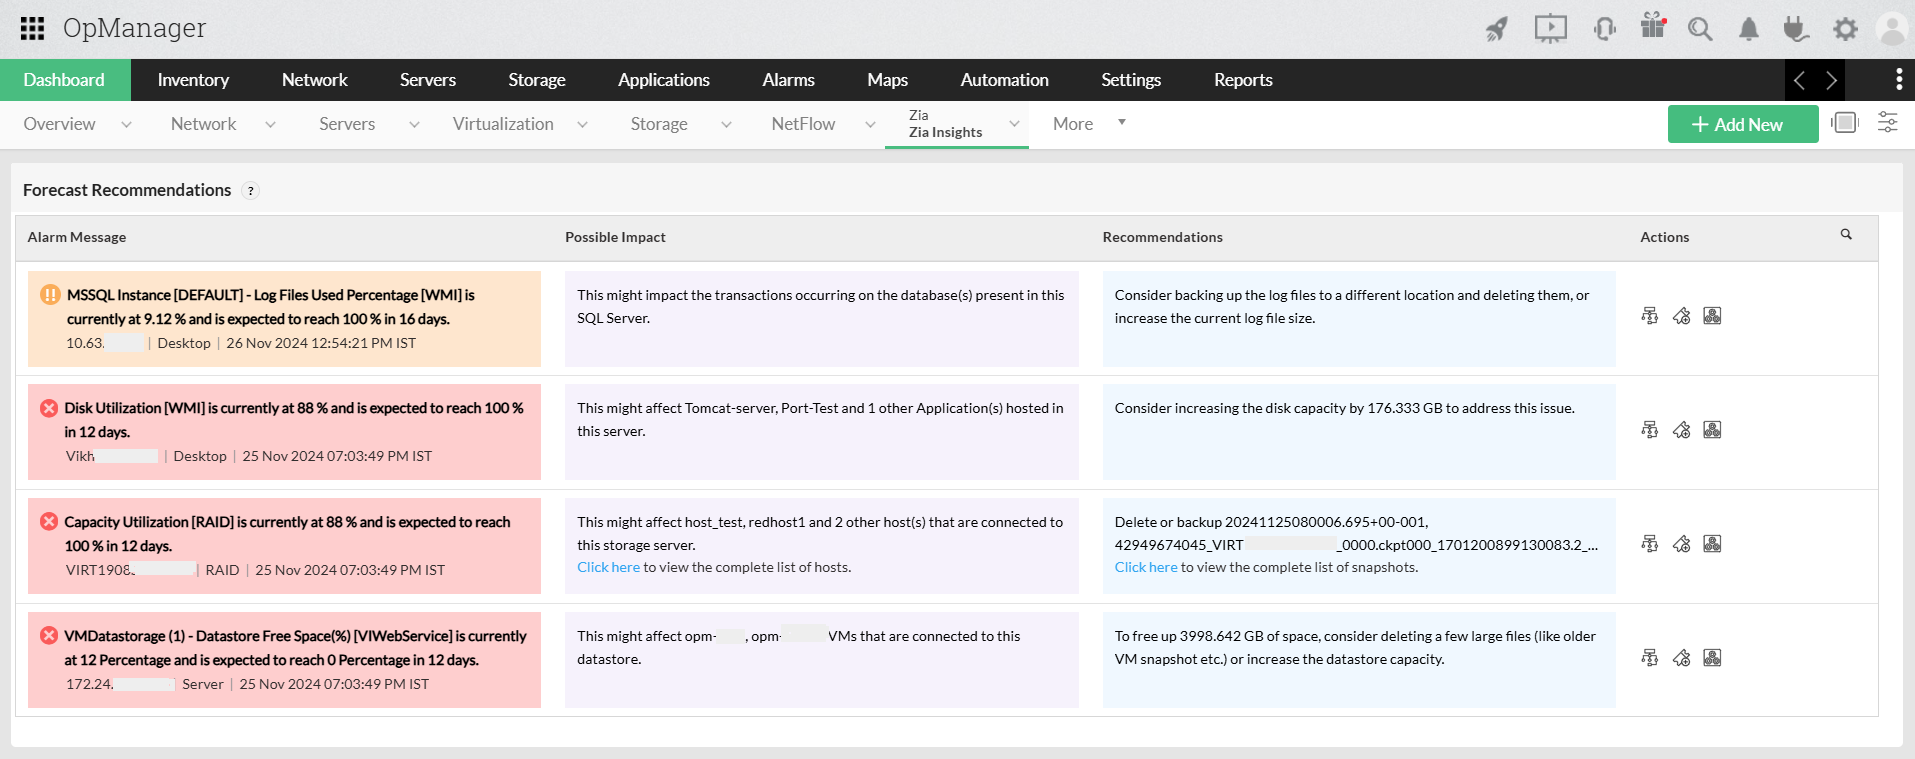
OpManager’s centralized server dashboard consolidates all critical metrics into one place. With customizable widgets, IT teams gain a holistic view of server health, enabling them to prioritize issues, track trends, and make informed decisions faster. Further, Zia dashboards go beyond monitoring by forecasting potential issues such as disk capacity exhaustion in advace. It also offers the impact of such incidents and offers proactive recommendations to mitigate them.

To learn more about these features and how it can help manage your network better, take a free personalized demo or try our product for yourself with our free edition.
More than 1,000,000 IT admins trust ManageEngine ITOM solutions to monitor their IT infrastructure securely
R