ManageEngine OpManager: How-tos
- General
- How to move OpManager from trial to production server?
- How to upgrade OpManager to the latest service packs or hot fixes?
- How to backup and restore data from an older version to a newer version of OpManager?
- How to view the current license details?
- How to enable/disable SSL in OpManager?
- How to remove the Intro tab in OpManager?
- How to upgrade OpManager to the latest service packs or hot fixes?
- How to migrate OpManager DB from one SQL to another?
- How to localize OpManager?
- How to fix the Time Zone difference issue in OpManager and OpManager-NFA plugin?
- What are the advantages of using the Discovery Rule Engine in OpManager?
- How are PgSQL parameters tuned and configured in OpManager?
- How to Configure Radius Server Settings?
- How do I control privileges for users in Auto-Login?
- How to update MSSQL password in OpManager after modifying the password for the database user?
- How to ensure if the SQL server configurations are valid?
- How to edit probe name in OpManager's Enterprise Edition?
- How to access device terminal in OpManager?
- How to disable terminal in OpManager?
Q. How to move OpManager from trial to production server?
A. .If you plan to take the trail installation as it is to production, all you need to do is register the license. Click the Register link on the top right corner in the Web console, browse and select the license file that you received from us and get going.
If you are planning to move the trial onto a new server to host it in production, here are the steps you need to fllow:
- Stop the trial edition.
- Backup the data.
- Install OpManager on the production server.
- Register it using the license procured.
- Stop OpManager
- Restore the backed-up data
- Start OpManager.
Note:
The procedure is same to move even your registered installation from server to another.
Again, the procedure is same for migrating from 32 bit to 64 bit OS and vice versa.
Q.How to upgrade OpManager to the latest service packs or hot fixes?
A. Fill in the form in the link given below:
https://www.manageengine.com/network-monitoring/service-packs.html
After you register, your Annual Maintenance Support contract is validated and if your AMS is active, an email is sent to you with the service pack/upgrade pack link and the steps to apply the same. In case you don't have a valid AMS, you will be directed to our Sales team to renew the AMS, following which the service pack is provided.
Q.How to enable/disable SSL in OpManager?
A. Steps to enable or disable SSL in OpManager:
For OpManager build 8050 and above.
- Open a CMD prompt and go under /OpManager/bin
- Execute ssl_gen.bat -f Enable
This will enable the self signed SSL certificate for OpManager. OpManager webclient can be accessed in the same port number with https://
To Disable the SSL :
- Open a CMD prompt and go under /OpManager/bin
- Execute ssl_gen.bat Disable [It is not required to use -f while disabling the SSL]
This will disable the self signed SSL certificate for OpManager. Hence the web-client can be accessed in the same port number with http://
For Builds older than 8050. (We have removed apache in build 8050)
- Stop OpManager Service.
- Ensure service window(services.msc) is closed.
- Invoke the opmanagerservice.bat from the prompt
OpManager[home] > bin > OpManagerService.bat -r - Rename apache folder under opmanager home.
- Download the apache.zip file attached below and extract it under opmanager home.
- From command prompt go to OpManager[home] > bin folder and execute the script ssl_gen.bat
- Go to opmanager home > bin > run the command below:
OpManagerService.bat -i - Start OpManager server.
Now you can try connecting to the web client with https i.e https://IPAddress:Port Number
Eg: https://192.168.223.23:80Note: The above steps will work with OpManager build 7010 and above.
Attachments:
Q.How to remove the Intro tab in OpManager?
A : You will mostly need this tab during evaluation to help you set up and configure the application to monitor your network. To remove the Intro tab in OpManager
1)connect to the DB bin:\>mysql.exe -u root -P 13306 OpmanagerDB (mysql.exe is under /opmanager/mysql/bin) 2)Execute this command. mysql>update panelprops set attribvalue='false' where nodeid='opmintro' and attribname='tab'; Now logout and login.
Q.How to upgrade OpManager to the latest service packs or hot fixes?
Service Packs and Hot Fixes are released from time to time and contain issue fixes, enhancements, changes, and new features.
- Download the service pack/hot fix. Its usually a file with .ppm extn.
- Shut down OpManager. (If OpManager is running as a service, stop the service from Control Panel > Services window)
- Take a backup by executing the command <opmanager-home>/bin/backup/BackupDB.bat. This is required only as a precautionary measure.
- Once the backup is done, run the script 'UpdateManager.bat (UpdateManager.sh for Linux) in the <opmanager-home>/bin folder. This opens the Update Manager tool.
- Click "Install" and then click "Browse" to select the Upgrade Pack file (the .ppm file that you'd downloaded).
- Follow the on-screen instructions to apply the Service/Upgrade Pack.
- Once the upgrade is complete, start OpManager Server.
Q. How to upgrade OpManager to the latest service packs or hot fixes?
A: Service Packs and Hot Fixes are released from time to time and contain issue fixes, enhancements, changes, and new features.
- Download the service pack/hot fix. Its usually a file with .ppm extn.
- Shut down OpManager. (If OpManager is running as a service, stop the service from Control Panel > Services window)
- Take a backup by executing the command <opmanager-home>/bin/backup/BackupDB.bat. This is required only as a precautionary measure.
- Once the backup is done, run the script 'UpdateManager.bat (UpdateManager.sh for Linux) in the <opmanager-home>/bin folder. This opens the Update Manager tool.
- Click "Install" and then click "Browse" to select the Upgrade Pack file (the .ppm file that you'd downloaded).
- Follow the on-screen instructions to apply the Service/Upgrade Pack.
- Once the upgrade is complete, start OpManager Server.
Q. How to migrate OpManager DB from one SQL to another?
A: 1. Stop the OpManager server and make sure the Java.exe processes are not running in the task manager.
2. Take a backup of your existing OpManager installation by executing the BackupDB.bat in the OpManager\bin\backup
3. This creates a backup file in the OpManager\backup folder with the current date like for example 'BackUp_OCT10_2011_02_39_44_8812.zip' .Wait till the backup completes.
4. Once the backup process is complete, select Start --> Programs --> ManageEngine OpManager --> DB Manager --> DB Configuration.
5. A DB Configuration window pops up. Select MSSQL option and click OK. Configure the following information:
DB Host : The name or the IP address of the machine where MSSQL is installed.
Port: The port number in which OpManager must connect with the database. Default is 1433.
User Name and Password: The user name and password with which OpManager needs to connect to the database.It would be better if you could provide the "sa" user name and password as OpManager uses metadata, to create the tables.
6. These steps will automatically create the database in the MS-SQL.However the tables will be created only after successful start of OpManager. So Start OpManager with MS-SQL as the back end and shut it down after the successful startup.
7. Now run the RestoreDB.bat file under \OpManager\bin\backup folder on the ...\OpManager\bin\backup>RestoreDB.bat "D:\backup\BackUp_OCT10_2011_02_39_44_8812.zip"
8. Once the restoration is complete, start OpManager. This should restore the data in MS-SQL database.
Q.How to localize OpManager?
A: OpManager is available in English, Spanish, Chinese Simplified, Chinese Traditional, Japanese, French, German, and Italian languages and it can be selected during installation. Below are the steps to change OpManager from one language to other supported language(English to Spanish).
1. By default the language will be set for English.
2. All supported Languages directory is maintained under OpManager\ancillary directory.
3. copy the serverparameters.conf from the respective language directory, for ex : Spanish \OpManager\ancillary\sp\html and replace them under OpManager\conf\ .
cn - Chinese [chinese simplified]
de - German
en - English
fr - French
it - Italian
jp - Japanese
sp - Spanish
tw - Taiwanese [chinese traditional]
kr - KoreanRestart OpManager.
Q.How to fix the Time Zone difference issue in OpManager and OpManager-NFA plugin?
A: If the time on OpManager is different from the Server time, follow the steps given below to fix the issue:
1. Save the attached file and rename it to time.jar and place it under \OpManager folder.
2. Open a command prompt and go to \OpManager folder and execute the command below by providing your exact time zone difference from the GMT.
cmd:/> jre\bin\java -Duser.timezone=GMT-9:00 -cp time.jar Time
Modify the query according to the time zone difference in your region. Here I am executing the query for changing the OpManager time to Alaska Time zone which is GMT -9.
3. Take a back up of wrapper.conf located under \OpManager\conf folder.
4. Open the wrapper.conf and search for Java Additional Parameters and at the end of the additional parameters, add the entry below.
wrapper.java.additional.12=-Duser.timezone=GMT-9:00
After modifying it, the changes will look as below.
# Java Additional Parameters wrapper.java.additional.1=-Dcatalina.home=apache/tomcat wrapper.java.additional.2=-Dmysql.home=mysql #wrapper.java.additional.3=-Dwebserver.port=80 #wrapper.java.additional.4=-Dresource_check="80,8009" wrapper.java.additional.3=-Djava.library.path=lib wrapper.java.additional.4=-Dwebserver.rootdir=apache wrapper.java.additional.5=-Djava.rmi.server.codebase=apache/tomcat/conf/workers.properties wrapper.java.additional.6=-Dcom.adventnet.me.opmanager.showprogress=true wrapper.java.additional.7=-Dcom.adventnet.me.opmanager.service=true wrapper.java.additional.12=-Duser.timezone=GMT-9:00
5. Save it and start OpManager as a service which will fix the problem.
Note: 1. The above changes will be in effect only if OpManager is started as a Service.
2. "wrapper.java.additional.12=-Duser.timezone=GMT-9:00" - This line needs to be place at the end of the file and also change the line number(eg: 12) accordingly.
Steps to correct the time difference issue in OpManager-NFA plugin
1. Goto OpManager\Netflow\bin folder and edit the "run.bat" in a text editor and search for the following line:
set JAVA_OPTS=%JAVA_OPTS% -Dprogram.name=%PROGNAME% -Djboss.server.type=com.adventnet.j2ee.deployment.system.AdventNetServerImpl
Change the above line as follows:
set JAVA_OPTS=%JAVA_OPTS% -Dprogram.name=%PROGNAME% -Duser.timezone=GMT-9:00 -Djboss.server.type=com.adventnet.j2ee.deployment.system.AdventNetServerImpl
2. Restart OpManager service and the Netflow module would show the correct time. Note:GMT-9:00 timezone is shown as an example.Please modify it as per your timezone.
Attachment: time.jar 606 B
Q.What are the advantages of using the Discovery Rule Engine in OpManager?
The Discovery Rule Engine in OpManager automates post-discovery configurations by allowing you to define custom rules that automatically apply specific actions to newly discovered devices.
With the Discovery Rule Engine, you can:- Automatically associate relevant performance monitors, such as process monitors, service monitors, or custom script monitors, to devices as soon as they are discovered.
- Define uniform monitoring intervals for different device types.
- Automatically add devices to business views, associate device templates, and assign notification profiles and event log rules based on discovery criteria.
- Trigger workflows immediately after discovery to automate remediation or initiate alert actions.
- Associate discovered devices with downtime schedules or automatically suppress alarms during planned maintenance windows to prevent unnecessary alerts.
Q.How to Configure Radius Server Settings?
To configure radius server settings, go to Settings -> General Settings -> User Management and enter the required details:
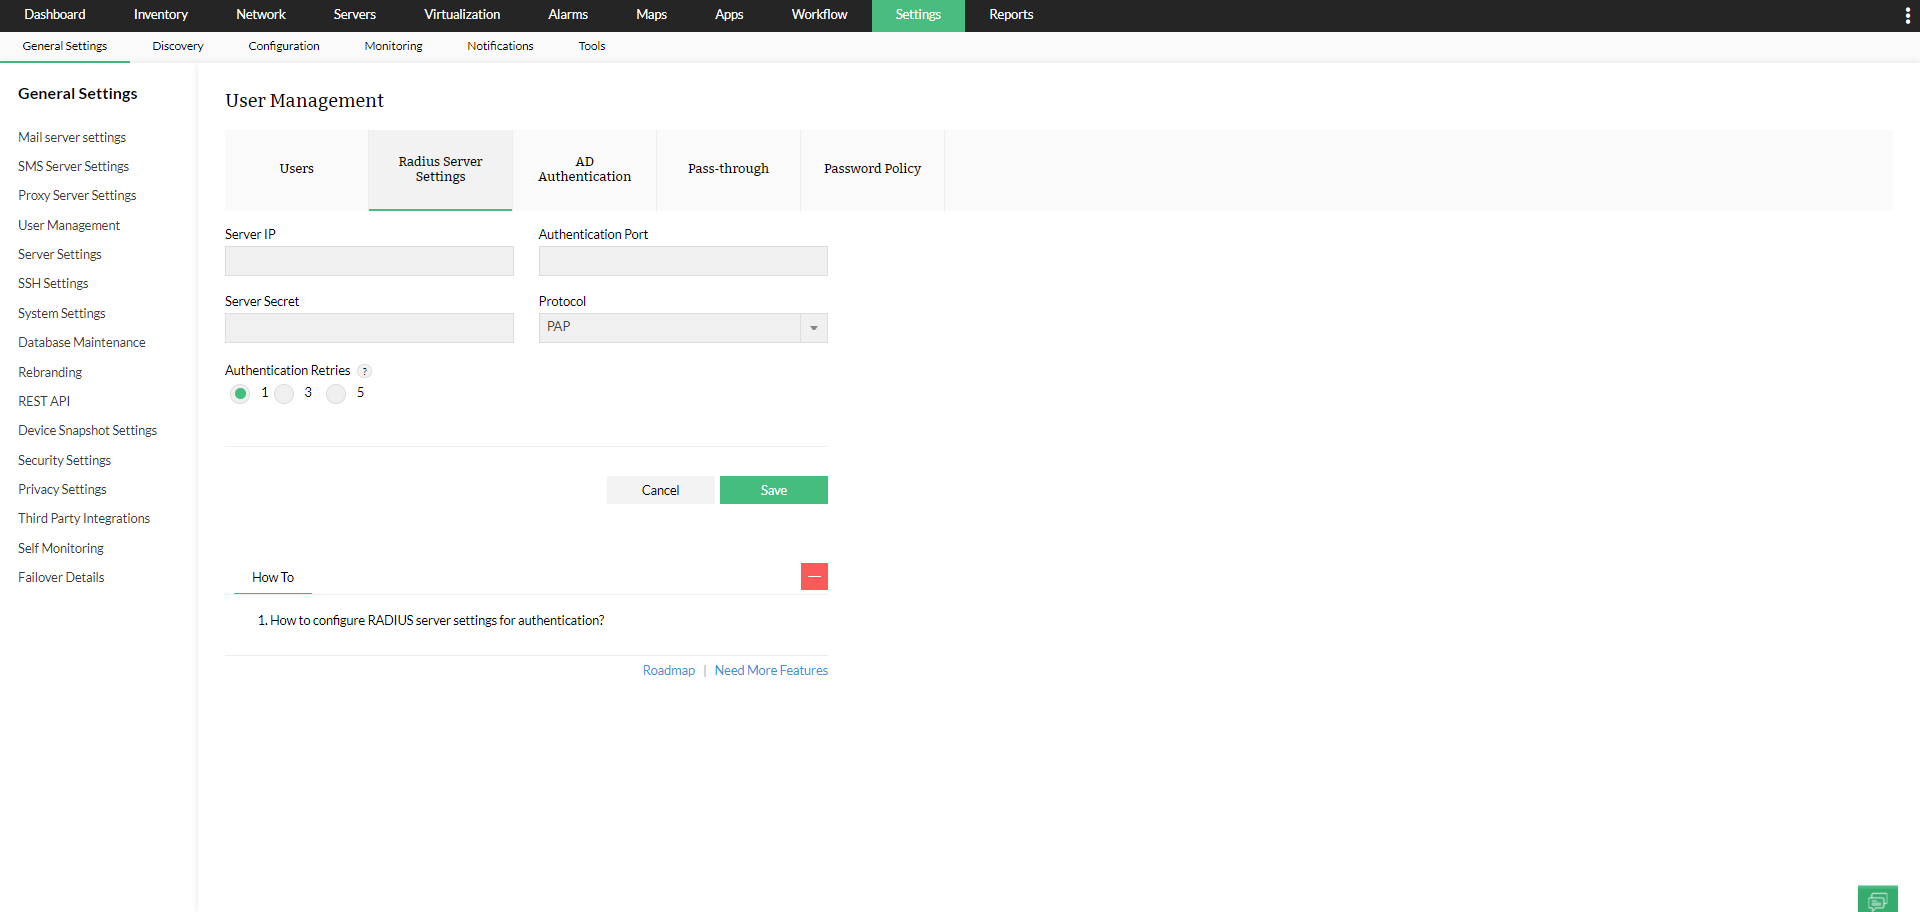
- Server IP: Enter the IP of the server where the radius server is running.
- Authentication Port: Port in which the server is running it (Normally 1812).
- Server Secret: Its the master password with which the details of the user configured in the radius server are retrieved.
- Protocol: Select the desired protocol from the list - PAP/CHAP/MSCHAP/MSCHAP2. This should be the protocol that the radius server uses for communication.
- Authentications Retries: Choose the amount of times that OPM should retry if there is a connection issue.
Q. How do I control privileges for users in Auto-Login?
Go to Settings -> General Settings -> User Management -> Add domain or edit an existing domain.
Enter the domain details and check the "Enable Auto Login" option.
In AD Auto-login, the login can be chosen to be allowed for 'All Users' or 'Select AD Groups'. In the case of 'All Users', privilege chosen will be applicable for all the users. In the case of 'Select AD Groups', the specific group names have to be mentioned in the Privilege box, and for those users belonging to that group the corresponding privilege will be assigned during their first login.
Q. How to update MSSQL password in OpManager after modifying the password for the database user?
- Open command prompt with administrative privilege and go to OpManager\bin directory.
- Execute DBconfiguration.bat, fill the new password and click on 'Ok' and 'Yes'.
- Now start the OpManager service, your MSSQL password would have been updated.
Q. How to ensure if the SQL server configurations are valid?
- Stop OpManager service. Open command prompt with admin privilege and go to <OpManager>\bin directory.
- Execute DBconfiguration.bat, and check again if the SQL server is running in the given host and port.
- If SQL server migration has been done, the new SQL host and port can be updated here.
- To save the configuration, click on 'Ok' and give 'Yes' for the pop-up that appears.
- If any error occurs, please contact our support team with the necessary screenshots and logs.
- If the connection is proper, you can start the OpManager service.
Note: Make sure that a minimum 1GB of free space is available in the drive where the SQL Server is installed.
Q. How to change the Probe name in OpManager's Enterprise Edition?
- A Probe's name can be changed even after the installation process.
- In the Central, navigate to Settings > Probe Details.
- Click on the Probe name that you want to edit.
- Type the new name and click on OK.
- After the update a success message wiil appear on the UI.

Q.How to access device terminal in OpManager?
In OpManager, the user can connect to a device's terminal via SSH and Telnet Protocols, and can execute commands.
To connect to the terminal, go to the device snapshot page and click on the Terminal icon.

Q.How to disable terminal in OpManager?
To disable terminal, go to Settings -> General Settings -> System settings and disable the Remote Desktop/Terminal option.
- Credentials
- How to configure SNMP V3 credentials for discovery?
- How to authenticate a Cisco device using SNMPv3?
- How are PgSQL parameters tuned and configured in OpManager?
- How can I add a new REST API credential profile into OpManager?
Q. How to configure SNMP V3 credentials for discovery?
A. .SNMPv3 is a user based security model. It provides secure access to the devices by a combination authenticating and encrypting packets over the network. The security features provided in SNMPv3 are Message integrity, Authentication and Encryption. If you select SNMPv3 as the credential type, then configure the following parameters.
Note: Only after configuring Authentication it is possible to configure Encryption.
- Name: Enter the name of the credential.
- Description: Enter a brief description about the credential.
- User Name: Enter the name of the user (principal) on behalf of whom the message is being exchanged.
- Context Name: An SNMP context name or "context" in short, is a collection of management information accessible by an SNMP entity. An item of management information may exist in more than one context. An SNMP entity potentially has access to many contexts. In other words, if a management information has been defined under certain context by an SNMPv3 entity, then any management application can access that information by giving that context name. The "context name" is an octet string, which has at least one management information.
- SNMP Port: Enter the SNMP port number.
- Authentication: Select any of the authentication protocols either MD5 or SHA and enter the password. MD5 and SHA are processes which are used for generating authentication/privacy keys in SNMPv3 applications.
- Encryption: Select any of the encryption protocols either DES or EAS-128 and enter the password.
Q. How to authenticate a Cisco device using SNMPv3?
A.
The Snmpv3 communication between two SNMP Entity starts with handshake process. This process contains two steps, first one is Discovery and second one is TimeSynchronization process. And for snmpv3 communication, the manager needs to know the agent's details inorder to communicate with the agent.
1. SnmpEngineTime.
2. SnmpEngineBoot.
3. SnmpEngine ID.
As per standard, the above information is retrieved from the Cisco router by using Discovery and TimeSynchronization process.
The net-snmp will accomplish both discovery and timesync process in a single request instead of two requests as the discovery response itself contains EngineTime, EngineBoot and EngineID. This behavior is implemented in our SNMP layer and will be rolled out in our next release. However, as per RFC3414, Cisco device should respond for discovery and timesync requests.
For your clear understanding, the discovery & timesync process is explained below:
Discovery Process:- First the Manager (OpManager) sends a discovery packet to the Agent to get the Agent's Authoritative EngineID value. For further communication, this EngineID value is used. As per RFC3414, the Discovery PDU packet is issued with following parameters:
i) EngineID value as zero length
ii) Security level is noAuthNoPriv
iii) UserName may be zero length or dummy userName.
For this request, the Agent responds with EngineID and UknownEngineID counter value. Instead of empty string, we use the userName as "initial". I would like to clarify that why RFC is recommend to use the userName is empty string, for discovery process is as follows Refer RFC3414 [Page 16] - The msgUserName specifies the user (principal) on whose behalf the message is being exchanged. Note that a zero-length userName will not match any user, but it can be used for snmpEngineID discovery. The reason is that the UserName of the request PDU is not matched with configured user details in the SNMP Entity (agent) while processing the Message. As per RFC3414, the processing of SNMP packet is as follows:
i) First, the SNMP Header field is decoded
ii) SecurityParameters fields are extracted from the Packet. First Authoritative EngineID value is extracted from the packet. If the EngineID is zero length, agent takes this request as Discovery and it responds with EngineID value with usmStatsUnknownEngineIDs counter value
iii) Refer the RFC3414 [Page 25] Processing an Incoming SNMP Message. b) the usmStatsUnknownEngineIDs counter is incremented, and an error indication (unknownEngineID) together with the OID and value of the incremented counter is returned to the calling module. Note in the event that a zero-length, or other illegally sized msgAuthoritativeEngineID is received, b) should be chosen to facilitate engineID discovery. Otherwise the choice between a) and b) is an implementation issue. The SNMP request packet is sent with zero length engineID value, so the cisco device(agent) should properly respond for this request irrespective of whether or not the userName is initial or empty string. It is a good practice to send with empty string. This is already implemented in our SNMP library.
TimeSynchronization Process:
The time synchronization packet is issued with given username and securitylevel as Auth_Priv. The agent responds with enginetime and engineboot and with USMStatsNotInTimewindow conter value. Note that the UserName from the second packet onwards, configured userName whose behalf the request to be issued will be set in the request packet. In this process, the authentication i.e authProtocol/ authPassword are verified.
Q. How are PgSQL parameters tuned and configured in OpManager?
A. In OpManager versions 12.5 and above (PgSQL 10.10 or above), the configuration changes (if any) can be done in the zz_itom_ext.conf file under <OpManagerHome>\pgsql\ext_conf.
Q. How can I add a new REST API credential profile into OpManager?
- Go to Settings → Discovery → Add IPMI page.
- Under the Credentials section, click 'Add credentials' and select "IPMI".
- In the following page, add all the necessary details for the credential profile.
- Click 'Save' once you have configured everything, and this profile can now be associated to any IPMI device for monitoring using REST API.
- Discovery
- How to import devices from CSV file for discovery?
- How to import devices from CSV file for discovery?(for OpManager versions 125174 and above)
- How to discover a select range of devices?
- How to ignore VLAN interfaces?
- How to increase the Ping timeout?
- How to change an interface as a WAN Interface in OpManager?
- How to add a VMware host?
- How to configure discovery credentials?
- How to discover HyperV devices?
- How to discover Class A, Class B, and Class C networks?
- How to classify the routers in the correct category?
- How to resolve the 'unknown' devices problem?
- How to add a device in a ICMP disabled environment?
- How to set the device DNS name as the display name?
- How to discover VLAN interfaces ?
- How to filter out unwanted devices during network discovery?
- How to apply the discovery rule engine for existing devices?
- How does Device model in WLC differs from Device Templates?
- Why I am not able to associate a normal device to WLC category?
- Why some or all access points of a Wireless LAN Controller is not listed under Access Point Inventory Page?
- How to automatically scan for new devices in my network?
- How to monitor Linux device using SSH authentication?
- My devices are added as unknown. How to resolve it?
- I have dynamic IP environment, how can I add device for monitoring using DNS name?
- How to discover IP range of different classes in your network?
- How to automatically scan the new devices in my network and discover it?
- What is the purpose of Discovery Rule Engine?
- How to perform interface discovery for approved devices?
- How to add a new storage device?
- How can I add an IPMI device in OpManager?
- How to perform in-depth monitoring of endpoints for a Cisco ACI?
Q. How to import devices from CSV file for discovery?
- Create a csv file with the details of name/ipaddress of the device, displayname and device type. You can check the Sample file for reference.
- Go to Settings > Discovery > CSV File Import, click on Browse and load the CSV file.
- Once it get loaded, you can see field details, 'Configure fields from CSV file'.
- The file is parsed and the headers are shown on the right hand side.
- Once you see the headers for each row, you can map the requried fields to the csv file.
- After you click 'Ok',proceed with the rest of the discovery to complete the process.
Note: DeviceName/IP header is a must for CSV file and other header fields are optional.
Q. How to import devices from CSV file for discovery? (for OpManager versions 125174 and above)
For OpManager version 125174 and above, follow the below steps to import devices from a CSV file
- Create a csv file with the details of Name/IPaddress, Display Name and Type of the devices in your network.
- Go to Settings -> Discovery.
- In the Network Discovery page, click on the New Discovery option on the top right corner.
- Click on the Import from CSV tab and import the created CSV file into OpManager.
- Once the file is parsed, the 'Configure fields from CSV file' popup opens.
- Map the fields in the CSV file to the corresponding headers and click on OK.
- Select the credentials and click on Discover to start the discovery process.
- In the following page, Approve/Ignore the devices to complete the process. Only the approved devices will be monitored and listed under Inventory. The ignored devices will be listed under Settings -> Discovery -> Ignored Devices and discarded from future scans.The devices ignored can be later removed from the list and added into OpManager for monitoring if necessary.
Note: DeviceName/IP header is a must for CSV file and other header fields are optional.
Q. How to discover a select range of devices?
To discover devices from a selected range specify the start and end ip address and select the netmask for the devices to be discovered within that range.
- Click the Settings tab.
- Under Discovery, select Discover Devices.
- Use IP Range: Select this option to specify the range.
- Start IP: Specify the IP address of the device in the range from where OpManager should start discovery.
- End IP: Specify the IP address till which OpManager should discover.
- Netmask: Select the correct netmask.
- Discovery Credentials: Select the configured Credentials to be used for discovery.
- Advanced SNMP Settings: Click here to configure an increase SNMP timeout or SNMP retries.
Q. How to ignore VLAN interfaces?
To ignore VLAN interfaces,
- Click on the router name to see the device snapshot page.
- In the Action menu (just above device availability chart) in the device snapshot page, access Configure Interfaces menu (for switches, the menu name is Configure Ports).
- Remove monitoring/status poll option for the VLAN interfaces.
Note: To disable Virtual LAN globally, try interface template.
Q. How to increase the Ping timeout?
For the all the devices by default OpManager sends one packet with time out as 1 sec. So if the WAN link stays busy, it is expected that OpManager will show that the devices on the other side as down. You can resolve this problem by increasing the ping time out, if needed even the packets sent to check the availability. However this facility will be common for all the device i.e. it is a global configuration.
Solution:
- Edit the file \\OpManager\\conf\\Ping.properties
- Remove the "#" against "timeout=1" and Change the timeout value to 4. This setting will make OpManager to wait for 4 seconds, if the device did not respond.
- If you wish to change the number of packets sent to check the availability of the device, remove the "#" against "count=" specify the desired number of packets to be sent to check the availability.
- Save and exit the file after the changes and Restart OpManager service for the changes to take effect.
Q. How to change an interface as a WAN Interface in OpManager?
BY default these are the list of interface types( type number and name) which are considered as WAN interfaces inside OpManager.
18 DS1
20 Basic ISDN
21 Primary ISDN
22 Serial
23 PPP
32 Frame Relay DTE
33 RS-232
37 ATM
44 Frame Relay DCE
45 V35
49 AAL5
63 ISDN
64 V11
94 ADSL
96 SDSL
166 MPLSTo include any other type of Interface as a WAN interface to get SLA dashboard "WAN links by availability" report, we need to add the specific type into a table called "WANINTFTYPES"
For example to add an Ethernet/Fast Ethernet (which is of type 6) as a WAN interface, connect to the DB and run this query:
To connect to the Database (Mysql):
1) Open the command prompt
2) Go to the Mysql\bin directory and type the following
OpManager\mysql\bin>mysql -u root -P 13306 opmanagerdb
3) execute the following statement
4) mysql > insert into wanintftypes values(6);
5)exit
Stop and Start Opmanager and generate the report for Wan links. You can see all the Ethernet interfaces included in the report.
Q. How to add a VMware host?
You will need to configure the VMware credentials for discovery before you actually proceed to discover. Here are the steps in detail:
- Go to Settings--> Discovery --> Credentials
- Click New in this screen
- Select the credential type as VMware and configure the following parameters:
- A name for the credential. Eg: VM_Floor1
- HTTPs User Name and Password for ESX Host
- HTTPs web service port number
- Timeout interval for the connection between the Host and OpManager server.
You might also want to configure WMI credentials for the VMs if you want to add any custom WMI monitors or Windows service monitors etc..
- Go to Admin-> Add Device. (You can also access the Add Device window from Maps-> Virtual Devices-> Add New Host).
- Enter the Host Name / IP Address.
- Enter the correct Netmask and select the appropriate credentials.
- Click Add Device button to add the host.
After successful discovery, you will find the VMs and Host under the Virtual Devices category under Maps.
Q. How to configure discovery credentials?
Pre-configuring a set of credentials in OpManager helps applying them to multiple devices at a time, saving a lot of manual effort.
1.Go to Settings --> Discovery --> Credentials
2.Click New in this screen
3.Configure the following parameters and click Add to add the credentials:
Credential Type: Select the relevant protocol.SNMP v1/SNMPv2: SNMPv1 and SNMPv2 are community based security models. Enter the Credential name and description. Configure the correct Read and Write community, and the SNMP Port.SNMP v3: SNMPv3 is a user based security model. It provides secure access to the devices by a combination authenticating and encrypting packets over the network. The security features provided in SNMPv3 are Message integrity, Authentication and Encryption. If you select SNMPv3 as the credential type, then configure the following parameters.Name: Enter the name of the credential.Description: Enter a brief description about the credential.User Name: Enter the name of the user (principal) on behalf of whom the message is being exchanged.Context Name: An SNMP context name or "context" in short, is a collection of management information accessible by an SNMP entity. An item of management information may exist in more than one context. An SNMP entity potentially has access to many contexts. In other words, if a management information has been defined under certain context by an SNMPv3 entity, then any management application can access that information by giving that context name. The "context name" is an octet string, which has at least one management information.SNMP Port: Enter the SNMP port number.Authentication: Select any of the authentication protocols either MD5 or SHA and enter the password. MD5 and SHA are processes which are used for generating authentication/privacy keys in SNMPv3 applications.Encryption: Select any of the encryption protocols either DES or EAS-128 and enter the password.Note: Only after configuring Authentication it is possible to configure Encryption.WMI: If you select WMI as the protocol, configure the Domain Name, the user name, and the password. Example:- TestDomain\TestUser. Also enter the credential name and description.Telnet/SSH: Enter the credential name and description. For Telnet/SSH, make sure you configure the correct login prompt, command prompt, and password prompt besides the user name and password to access the device.VMware: Provide the HTTPS Username and Password of the Host. Enter the HTTPS web service port number and timeout interval for the connection between the Host and OpManager server. The SNMP credentials created is used during the initial discovery and classifications. OpManager uses these credentials to classify and add the devices into OpManager.Using Quick Configuration Wizard
You can also use the Quick Configuration Wizard to associate a service to several devices at one go. Here are the steps:
- From the Configuration tab, in Settings select Quick Configuration Wizard.
- Select the option Associate a credential to several devices and click Next.
- All the available Credentials are listed. Select the Credential which you want to associate to your devices.
- Select the devices to which you want to assign the credential from the column on the left and move them to the right.
- Click Finish. The Credential is associated to the selected devices.
Q. How to discover HyperV devices?
Hyper-V devices are automatically discovered by OpManager and classified under the Virtual Devices map. Hyper-V is discovered in OpManager using WMI credentials.. So all you need to do is
- Ensure that the device is WMI-enabled
- Configure the WMI credential in OpManager.
- Select the credential type as Windows
- Configure the Domain Name, the user name, and the password. Example:- TestDomain\TestUser.
- You can either add just the device for discovery or also add the network if you going to discover the other devices too on the same network. As mentioned above, even if you add the network for discovery, OpManager will properly classify them as Hyper-Vs.
Q. How to discover Class A, Class B, and Class C networks?
Class A Network
The entire class A predominantly begins with 10.and is private, to be used in LANS When discovering Class A networks, do the following:
- Specify the IP range or the network address that you'd like to discover
- Select the netmask as 255.0.0.0
- Select the relevant discovery credentials from the list of configured credentials
- Click Discover
The Host Address Range for Class A Network: 10.0.0.1 – 10.255.255.254.
Class B Network
When discovering class B networks, the procedure is the same. Make sure you select the netmask as 255.255.0.0. The Host Address Range for Class B Network: 172.16.0.1 – 172.16.255.254
Class C Network
When discovering class C networks, the procedure is again the same. Make sure you select the netmask as 255.255.255.0.
Q. How to classify the routers in the correct category?
Prerequisites:
Must be pingable
Must have SNMP enabled
Before you add, quickly run this check:
Check 1
- Open the MibBrowser.bat from /OpManager home/bin directory
- Load the RFC 1213 Mib. Enter the router name or IP address and the read community string
- Expand the MIB to org -->dod --> internet --> mgmt --> mib2 -->system --sysObjectID (sysOID)
- Select sysOID and hit GET. You must get a resposne to this query.
Check 2
- From Settings --> Configuration --> Device Templates, select the relevant template under which you this the router must be classified.
- Click on a template name to see the template definition.
- In the System OID column in the template, ensure the sysOID of your router is listed. If it is not, click on the Query Device button that you see here and select the sysOID from the RFC 1213 Mib.
- You can also check if you want to add more monitors, or you can always come back to it later.
- Save the changes if you have made any, like updating/populating the sysOID.
Proceed
Now, add the router for discovery. It will be properly classified and monitored.
Q. How to resolve the 'unknown' devices problem?
We have seen what are unknown devices. Let us see what you need to do to resolve the problem.
To reduce the number of devices getting classified as 'Unknown', configure the correct credentials even before initiating discovery. Doing this saves a lot of time and effort on re-work.
Resolving Unknown devices in the devices already discovered
SNMP-enabled devices
If the device supports SNMP, enable SNMP and rediscover the device. Despite this, if you face issues, troubleshoot as follows:
- Do you see a blue star in the device icon on the maps? This implies that the device responds to SNMP request from OpManager. The device is still not classified properly? Simply edit the category from the device snapshot page.
- If SNMP agent is not running on the router, it will be classified as a server or desktop.You can verify this by the blue star appearing on the top left corner of the device icon for the SNMP-enabled devices. To categorize the device properly, start the SNMP agent in the device. Refer to Configuring SNMP agents in Cisco Devices for details. Rediscover the device with correct SNMP parameters.
- If the SNMP agent is running on the router and you still do not see the blue star in the device icon, then check if the SNMP parameters are properly specified during discovery. If not, rediscover the device with correct SNMP parameters.
- The router is discovered as a server or desktop if the IP Forwarding parameter of the device is set to false. To set the value of this parameter to true
- Invoke /opmanager/bin/MibBrowser.bat
- Expand RFC1213-MIB.
- In the ip table, click ipForwarding node.
- Type 1 in the Set Value box and click Set SNMP variable on the toolbar.
- Rediscover the device with correct SNMP parameters.
Similarly, for switches and printers too, enable SNMP in the device and rediscover.
CLI / WMI-enabled devices
If you have decided to disable SNMP authentication on Unix-based servers, configure Telnet or SSH credentials and associate the credentials to the servers. Similarly, for Windows devices, configure WMI credentials and associate the credentials to the devices. Re-discover the devices with the new credential
Q. How to add a device in an ICMP disabled environment?
Devices in an ICMP disabled environment will not be reachable from the OpManager server. Such devices can be added by the following methods:
- Add Device: By using Add Devices feature, such devices can be added individually. This feature can also be used to add devices that are not pingable.
- CSV File Import: This option can be used to import multiple devices to OpManager including the ones that are not reachable.
- TCP based polling: If you have a TCP based environment, you can add devices via the above two methods, change the 'Monitored via' option to TCP in the respective device snapshot page and start monitoring.
Q. How to set the device DNS name as the display name?
To set the DNS name of a device as its display name, enable the "Use DNS as Display Name" option under Discovery Settings. You can also update the device displayname post discovery.
- Go to Settings -> Configuration -> Quick Configuration Wizard.
- Click on Update Device DisplayName tile and select the Configure DisplayName tab.
- Choose the FQDN as Display Name option and select the devices. The device DNS name will now be updated as Dislayname for the selected devices.
Note: Enabling this option will only modify the newly added devices. The existing devices will not be affected.
Q. How to discover VLAN interfaces ?
To discover VLAN interfaces, go to the device snapshot page, select a network device and click on 'right corner icon' for more actions -> VLANs -> Discover VLANs.
VLAN discovery can be done only in Switch and Router category devices and VLAN enabled interfaces will be discovered only if the SNMP agent responds to the OIDs from this page.
Q. How to filter out unwanted devices during network discovery?
To add/ignore devices during network discovery,- Go to Settings -> Discovery.
- In the Network Discovery page, click on the New Discovery option on the top right corner and click on Want to ignore devices?
- Select the discovery action (add/ignore device), define the type and specify the devices.
- Click on Add and continue with the discovery process. The specified devices will be ignored/added according to the defined criteria.
Q. How to apply the discovery rule engine for existing devices?
Go to Settings -> Discovery -> Discovery Rule Engine. Choose the appropriate discovery rule that you wish to associate to the existing devices and click on the Run Now option on the top right corner. Select the devices and click on Run to apply the chosen discovery rule to the existing devices.
Q. How does Device model in WLC differs from Device Templates?
Device Templates contain information to classify devices and associate monitors to them automatically. WLC Device model, although a device template internally, OpManager allows you to choose the device template that corresponds to your device prior to discovery. OpManager provides support to many WLCs, if your device is not on the list, click on Request here and fill up the form to enable us to develop support for your WLC.
Q. Why I am not able to associate a normal device to WLC category?
Wireless LAN Controller and Access Points categories are automatically assigned during WLC discovery. They cannot be assigned manually like other categories.
Q. Why some or all access points of a Wireless LAN Controller is not listed under Access Point Inventory Page?
Only the access points that are subjected to Advanced monitoring will be displayed in the Inventory page. Advanced monitoring will allow you to monitor multiple functionalities such as availability, health, signal, alerts, notifications, etc. of your Access Points.
Q. How to perform interface discovery for approved devices?
Interface discovery for approved devices can be performed either from the Device Snapshot page or from the Interface Discovery(only for versions 125174 and above) page.
- Device Snapshot page:
- Go to the device snapshot page of the discovered device.
- In the Interface tab, click on the Discover Interfaces option.
- The interfaces associated with your device will be discovered and added in OpManager.
- Interface Discovery page:
- Go to Settings -> Discovery -> Interface Discovery
- Define a condition and criteria for interfaces to be discovered.
- Click on the Discover option to start discovering interfaces that matches the specified criteria.
Q. How can I add an IPMI device in OpManager?
- Go to Settings → Discovery → Add IPMI.
- Select the applicable vendor for your IPMI device. For now, OpManager supports these vendors and protocols:
- Dell - SNMP and API
- HP - API
- IBM - SNMP
- SuperMicro - API
- Provide the IP address of the IPMI device, select the suitable credential profiles and click 'Discover' to start the discovery process.
Q. How to perform in-depth monitoring of endpoints associated with a discovered Cisco ACI?
You can perform in-depth monitoring of end-points (associated with a Cisco ACI) by enabling Advanced Monitoring in the Cisco ACI's device snapshot page. Learn more.
- Inventory
- How to configure interface to generate alerts?
- How to generate Traffic and Utilization report for set of interfaces?
- How to calculate interface traffic using different OIDs?
- How to configure poll interval for availability monitoring?
Q. How to configure interface to generate alerts?
Interfaces can be configured to generate the following types of alerts
- Utilization
- Error Rate
- Discard Rate
- Bandwidth Exceeded alert
- Interface down alert (automatic)
To configure interface alerts, go to Configuration > Interface Templates and click on the a template. Specify the Condition and Threshold Value for the alert to be generated.
For Bandwidth exceeded alert: Go to Settings > System Settings > and enable Alert when interface bandwidth exceeds its speed to receive bandwidth alerts.
Interface down alert is automatically triggered when an interface is down. This alert cannot be disabled.Q. How to generate Traffic and Utilization report for set of interfaces?
- Go to Inventory > Interfaces
- Select the required interfaces and click on Generate Reports button on the top right corner
- Choose the required time period and time window
- Select monitoring parameters
- Rx Traffic (Data reception traffic in the interface)
- Tx Traffic (Data transmission traffic in the interface)
- Rx Utilization - Reception utilization
- Tx Utilization - Traffic utilization
- Click on Generate Report
- The report is displayed on a new page. It can be customized to area chart, bar chart or line chart
- Reports can be either saved to OpManager by clicking on Save or exported as PDF by clicking on PDF button.
Q.How to calculate interface traffic using different OIDs?
In Opmanager, you can calculate the interface traffic using different OIDs via a Performance Monitor. The Interface traffic is calculated using the following formulae.
In Traffic(bps) : Rx Traffic : InOctets*8*1000/deltatime.
Out Traffic(bps) : Tx Traffic : OutOctets*8*1000/deltatime.By specifying the correct Vendor name and OID, you will be able to create a custom performance monitor that will help you in monitoring the interface traffic of any interface in particular. To create a performance monitor,
- Go to Settings -> Monitoring -> Performance Monitor and click on the Add Monitor option.
- Go to the Bulk SNMP tab. Enter a new vendor name or select from the existing ones.
- Enter the SNMP OID in the following format - OID*8/$DELTA_TIME.
- Enter the monitor name, interval, and configure the threshold values.
- Click on OK and associate the new monitor with the interfaces you wish to monitor.
Once the polling is started, the newly created monitor will calculate the interface traffic and display it in the form of graphs and tables.
Q.How to configure the poll interval for availability monitoring?
Based on the poll interval, OpManager will ping the device to get the availability status of the device. To configure the poll interval, follow the steps given below.
- Click on the Inventory tab and click on a particular device to open the summary page of the device. The summary page is usually called as the 'Device Snapshot page'.
- Click on More icon on the top right corner.
- Click on Availability Monitoring.
- Configure the Poll Interval and click Save.

- Monitoring
- How can I discover a newly added VM automatically?
- How can I start monitoring newly configured VMs inside the Hyper-V Server?
- How can I discover a UCS in OpManager?
- How can I add a custom WMI monitor?
- How can I associate monitors to devices under a particular device type?
- How can I monitor each instance separately in a monitor that has multiple instances?
- How can I configure thresholds for multiple Application monitors (like AD, MSSQL & Exchange) at once?
- How do I automate addition of MSSQL monitors to devices?
- How can I receive notifications if any of the AD/Exchange/MSSQL Services goes down?
- How can I configure a URL template in OpManager?
- How can I automate associating URL monitors to devices?
- How can I automate association of File Monitors to devices?
- What should I do to get notified when the thresholds of any of the File Monitors is violated?
- How can I automate association of Folder monitors to devices?
- How can I get notified if any of the Folder monitors violate their threshold?
- How does Agent-based file monitoring in OpManager work?
- How can I enable Debug Print Logging for OpManager Agent?
- How will I know if the agent in any of my devices goes down?
- How can I enable or disable Eventlog Monitoring?
- How can I automate associating Eventlog Monitors to devices?
- How can I receive notifications for the generated Windows Event Logs?
- How can I monitor various Processes running in a device?
- How can I automate actions like Start/Stop Processes in a device ?
- How can I automate associating Process Monitors to device?
- How can I receive notifications if any process is down or the threshold is violated?
- How can I disassociate a Windows Service monitor from devices?
- How can I automate actions like Start/Stop/Pause Windows Service in a device?
- How can I automate adding Windows Service monitors to device(s) ?
- How can I receive notifications if any Windows Service is down?
- How can I remove a Service Monitor from multiple devices?
- How can I automate associating Service Monitors to a device?
- How can I receive notifications if any service is down in a device?
- How to add a VoIP Monitor?
- How does VoIP monitoring work in OpManager?
- How to add a WAN RTT monitor?
- How to disable Switch Ports?
- How to configure thresholds for multiple interfaces?
- How to monitor the services running in the secondary IP address of the server?
- How to add custom WMI monitors in OpManager
- How to monitor only select/specific VMs on a host?
- How do I check if my device is RFC1213 or RFC2096 compliant?
- How to monitor temperature on Cisco 2960 Switch?
- How to add Active Directory monitors in OpManager?
- How to enable SLA responder on a monitored device?
- How to configure call settings?
- How to monitor a shared folder?
- How to add a custom dial graph for a custom monitor?
- How to manage devices using the DNS name?
- How to troubleshoot WAN latency issues?
- How to add a WAN monitor using snmp v3 with write permissions?
- How to monitor Latency between devices, say for instance, between the border routers to the dslams. Is it possible?
- How to enable https on ESX servers?
- How to enable SNMP on ESXi 4.0?
- How to enable SNMP on ESXi 4.1?
- How to configure negative thresholds for bulk monitors (multiple monitors at a time)?
- How to import/export script monitoring templates?
- How to associate script monitoring templates to multiple devices?
- How to add script monitors to individual devices?
- How to alert when a particular AD account credentials are used with the server or service it used?
- How to change the threshold to only alert if a device is not reachable for 15 minutes or over?
- How to use script monitoring to query values from a database and alert based on the value returned as the query output?
- How to remove a custom SNMP monitor?
- How to monitor DHCP scope?
- Can I pause monitoring of my devices during weekend?
- How to configure monitoring interval in bulk? and for few devices of the same category?
- I have a bunch of serial numbers of my devices. How to add them to devices?
- How to associate threshold settings to an Interface Group?
- How to use Groups as filters for dashboard widgets?
- How to configure status of a Group?
- How can I start/stop monitoring a server related to a IPMI device?
- How can I disable monitoring for a sensor in OpManager?
- How can I update the internal IP address/public NAT IP address of the OpManager server to the agents?
- How can I monitor occurrence of multiple strings in the file content for log file monitors in OpManager?
- How to dissociate a performance monitor from device(s)?
- How to associate a monitor based on various categories?
- How to associate a monitor to probe and its devices from OpManager central?
Q. How can I discover a newly added VM automatically?
OpManager automatically updates all the VMs created under a Host or under the vCenter environment, but they are not monitored by default. To enable monitoring of new VMs by default, the 'Auto VM Discovery' option must be enabled for the corresponding credential profile. It can be done by two ways:
- For a new credential profile, it can be enabled during discovery of the Host/vCenter.
- For an existing profile, you can go to Settings → Discovery → Credentials, select the required profile and enable the 'Auto VM discovery' option in the 'Edit Credential' window.
Q. How can I start monitoring newly configured VMs inside the Hyper-V Server?
- OpManager periodically scans the Hyper-V servers and updates the information on newly added VMs. If you've added a new VM and it's still not updated in OpManager, go to the Snapshot page of the Hyper-V server, click More Options and select 'Rediscover device' to update all info about the Host and its VMs.
- Sometimes, there are VMs that have been discovered by OpManager but they will be added in unmonitored state. To start monitoring those VMs, go to the Device Snapshot page of the Hyper-V host and click on the 'Virtual details' tab. Under the Virtual Machines section, click on the green 'Start Monitoring' button (if available) to monitor that VM too. Note that the mentioned button will be available only if the VM is currently not monitored.
Q. How can I discover a UCS in OpManager?
UCS discovery in OpManager is performed similar to the discovery of other devices.
- Go to Settings → Discovery Module.
- Click the 'Add UCS' option. How to dissociate a performance monitor from device(s)?
- Input the Device Name/IP Address.
- Select the 'Add Credential' option and click on 'UCS' to input the credential details.
- Configure credentials by providing the User Name, Password, Port number, Timeout and Protocol details.
- When the UCS is discovered, it is listed under OpManager's Inventory.
Q. How can I add a custom WMI monitor?
- Go to Settings → Performance Monitors.
- Click 'Add monitor' and select the WMI tab.
- Select the device you want to add the custom WMI monitor for, and provide valid credentials and monitoring interval before clicking 'Next'.
- In the following screen, select a suitable WMI class and OpManager will list all the Performance counters related to that class, along with the list of all instances that can be associated to that counter.
- Select the applicable counter and instances, and click 'Save'.
Alternatively, you can also create a custom WMI monitor in these ways:- From the Device Snapshot page of any device, by going to the 'Monitors' tab and selecting 'Add WMI monitor' under the Actions Menu.
- From the Device Templates page, by clicking 'Add' next to Associated monitors inside any template.
Q. How can I associate monitors to devices under a particular device type?
You can use the Device Templates available in OpManager to associate specific monitors to a device type.
To associate a monitor to an existing template:- Go to Settings → Configuration → Device Templates, and click on a template of your choice.
- The list of associated monitors for that template are displayed. Click 'Add' next to the Associated Monitors section.
- In the following screen, you can select from the existing list of monitors, or you can add a custom SNMP/bulk SNMP/WMI monitor. Provide all the necessary details and finally click 'Save'. Now the monitor is added to the template.
- To save this monitor to the template and associate it to existing devices of your choice, click 'Save & Associate'.
- Else, if you want this monitor to be associated only to devices will be discovered in the future, click 'Save'. The new monitor will be associated to the template, and any device that gets discovered under this template in the future will have this monitor enabled by default.
Q. How can I monitor each instance separately in a monitor that has multiple instances?
When creating Performance monitors, OpManager allows you to monitor each instance of the variable as a separate monitor, providing more freedom over setting thresholds for individual instances.
OpManager allows this to be performed for custom SNMP and WMI monitors.
For custom SNMP monitors:- While creating a new custom SNMP monitor after providing the OID and device type details, click 'Query device' to check if the device is responding for that request. Once it's done, step 2 is where you configure the Graph details for the monitor.
- In this screen, enable the option 'Do you wish to create each instance as individual monitor?'. Now, OpManager creates each instance of the monitored variable as a separate monitor.
- For more details, please have a look at OpManager's help documentation on this topic.
- In OpManager, each instance is created as a separate monitor for all WMI monitors by default.
- In the WMI tab under 'Add monitor', provide the device and its credentials, and OpManager lists all the WMI classes that are available for that device.
- Once you select the applicable class, the available performance counters and their instances are listed. Select the required counters & instances, and click 'Save'.
- Now, each counter-instance combination provided will be added as a separate monitor, and will be listed under Custom monitors in Settings → Performance Monitors.
Q. How can I configure thresholds for multiple Application monitors (like AD, MSSQL & Exchange) at once?
You can configure thresholds in bulk from the Application Monitors window in OpManager. To do so:
- Go to Settings → Monitoring → Application Monitors.
- There are several tabs for different applications like AD, MSSQL and various versions of Exchange server. Select the suitable tab, change the thresholds as required and click 'Save Configuration'. When you perform this action, these thresholds are applied only to apps being added to OpManager in the future.
- If you want to change and assign the thresholds right away, follow the same step as above. Once you've saved the configuration, select the new thresholds that you wish to apply and click 'Apply configuration'. The list of available devices for that device is listed. Select the desired devices and click 'Save'. This associates the thresholds to the devices right away.
Q. How do I automate addition of MSSQL monitors to devices?
You can automate adding monitors to specific devices using Discovery Rule Engine. OpManager has a default rule in Rule Engine to associate MSSQL monitors to relevant devices. In case it is not available, you can configure it as below
- Go to Settings → Discovery → Discovery Rule Engine.
- Click on 'Add Rule', and provide the criteria to select which devices you want to associate the monitors to and click 'Add' next to it. Note that you can add multiple criteria based on which you want to filter this device list.
- Under 'Actions', select 'Associate MSSQL monitors', and select if you want to associate them to all instances or just the default instance. Click 'Add' next to it to add that action. You can also configure multiple actions here.
- Click 'Save' once you're done providing the criteria and actions. The next time OpManager discovers a device that satisfies the criteria provided here, it will automatically associate the monitor(s) provided in the 'Actions' section.
In case you wanted to associate the MSSQL monitors to already discovered devices, you can do so by selecting any of the rules and clicking 'Re Run' from the Discovery Rule Engine page.
Q. How can I receive notifications if any of the AD/Exchange/MSSQL Services goes down?
OpManager's Notification Profiles allows you to configure profiles to get notified when specific events occur in the network, including when any of the AD/Exchange/MSSQL services in your network goes down. The following example explains about configuring notifications for AD services going down.
- Go to Settings → Notifications → Add Profile.
- Choose the medium over which you wish to get notified by choosing from the tabs available. You can get notifications over a wide range of media like SMS/Email/Web alarms in the UI, or you can even choose to log tickets in ServiceNow or ServiceDesk Plus.
- Once you configure the medium, click 'Next' to provide the criteria for the notification to be sent.
- Select the option 'When any Active Directory services are down'. This enables notifications to be sent when any AD service in your network is down.
- If you wish to receive notifications only when select AD services are down, click the green button that says 'Selected'. Select the services you wish to get notified about, and click 'Done'.
- Proceed with providing the other details required and finally click 'Save' to add this profile.
Q. How can I configure a URL template in OpManager?
To configure an URL template, follow these steps:
- Go to Settings → Monitoring → URL Monitors, select the URL Templates tab and then click 'Add template'.
- Provide the monitoring details such as URL, monitoring interval, match content (if required), and URL authentication details (if applicable). You can also add wildcards ($DEVICENAME$ or $IPADDRESS$) in the URL field to contextually change the device name / IP address for every device you associate this template to.
- Once you're done, click 'Save'. The monitor you added will be saved as a URL template.
- To associate this template to device(s) of your choice, click 'Associate' in the URL Templates window and select the template you wish to associate. Then select the devices and click 'Associate'.
Q. How can I automate associating URL monitors to devices?
You can use Discovery Rule Engine to associate URL monitors to devices during their discovery. To configure this, follow the steps below:
- Before setting up the Rule Engine, make sure the monitor you wish to associate has been added as a URL template. This is crucial to setting up the rule, as only the configured URL templates will be listed in the options. You can also configure a template from inside the rule itself.
- Go to Settings → Discovery → Discovery Rule Engine.
- Click 'Add Rule', and proceed to provide the criteria to determine which devices you want to associate the URL monitor to.
- Under 'Actions', select 'Associate a URL monitor' from the first dropdown, and select which URL template you want to associate to these devices. If you haven't configured the template yet, click 'Add a new URL template' and the new template can be configured in the popup window. Make sure to save the template, and click the Refresh button next to the dropdown in the Add Rule page to display the newly created rule in the options.
- Once you've selected it, click 'Save'. Now OpManager will associate the URL monitor by default to the devices that satisfy the provided criteria.
If you want to run this rule for devices that you've already discovered, you can do so by selecting the necessary rules and using the 'Re Run' option.
Q. How can I automate association of File Monitors to devices?
OpManager allows you to automate associating File monitors during discovery using the Discovery Rule Engine. Before you configure the rule, make sure that you have added the File monitoring template already in Settings → Monitoring → Files.
Q. What should I do to get notified when the thresholds of any of the File Monitors is violated?
To receive notification when any of the File Monitor thresholds are violated:
- After configuring the File monitoring template, navigate to Settings → Notification Profiles and click 'Add'.
- Choose the method with which you wish to get notified, or if you want to log a ticket / execute a command / send syslog or trap messages.
- Based on the method you choose, you'll have to provide a few details in order to successfully configure the profile. Once you're done, click 'Next' to choose the criteria in the next page.
- In the criteria list, enable the option 'When any File Monitors have violated the threshold'. If you want to receive notification only when specific File Monitors violate the thresholds, you can do so by tapping on the green 'Selected' button and choosing the monitors.
- Proceed to provide all other necessary details and save the profile to start receiving notifications for File monitors.
Adding File monitoring templates | Notification profilesQ. How can I automate association of Folder monitors to devices?
You can use Discovery Rule Engine to automate association of Folder monitors to specific devices during discovery. To know in detail on how to do it, refer to our help documentation on Discovery Rule Engine in OpManager.
Q. How can I get notified if any of the Folder monitors violate their threshold?
To set up a notification profile for folder monitor-related alerts, follow these steps:
- Ensure that you've added the Folder monitoring template, under Settings → Monitoring → Folders.
- Once you've configured it, go to Settings → Notifications → Add Profile and select the medium over which you want you to get notified.
- Provide the necessary details, and proceed to the next page to provide the criteria to get notified. In the criteria list, select the option that says 'When any Folder monitor has violated a threshold'. If you want to get notified only if certain Folder monitors have violated the threshold, you can do so by clicking on the green 'Selected' box and selecting the monitors of your choice.
- Provide all other details necessary and save the profile to start receiving notifications.
Adding Folder monitoring templates | Configuring notification profilesQ. How does Agent-based file monitoring in OpManager work?
OpManager's file monitoring agent allows you to monitor your log files for occurrence of a string/combination of strings such as error messages during execution or exceptions, and raise contextual alerts based on the string found and the number of times it has been found in a particular log file. You can provide multiple conditions and choose whether you want to be alerted when all/any of the conditions are satisfied.
You can also use Regular Expressions as criteria, and OpManager will raise alerts when content that satisfies the provided RegEx is found.
You can know about Agent-based file monitoring in detail in this help document: Monitoring log files using agentQ. How can I enable Debug Print Logging for OpManager Agent?
These steps are to be performed only in the agent-installed device.
- Open the Registry Editor in the agent-installed device.
- Navigate to HKEY_LOCAL_MACHINE → SOFTWARE → Wow6432Node → ManageEngine → OpManagerAgent (HKEY_LOCAL_MACHINE → SOFTWARE → ManageEngine → OpManagerAgent for 32-bit Operating Systems), right-click on AgentLogLevel and click Modify.
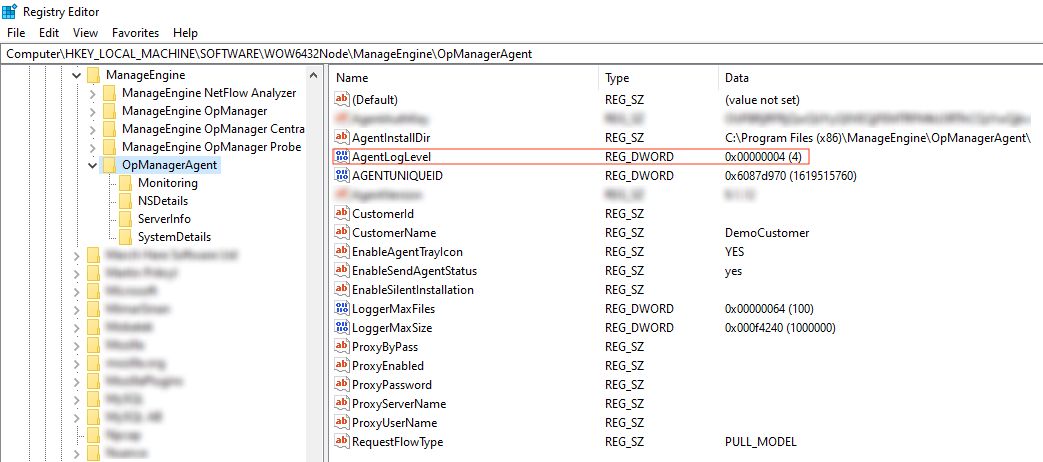
- In the "Select Base (Decimal)" field, provide the value as "4".
- Save the changes and restart the ManageEngine OpManager Agent service to enable printing debug logs.
Q. How will I know if the agent in any of my devices goes down?
When the agent installed in any device goes down, OpManager alerts the user through web alarms. If you want to get notified through a different medium, you can set up a notification profile as follows:
- Go to Settings → Notification Profiles → Add and select the medium over which you want to get notified from the tabs provided. Once you're done configuring the necessary settings for that medium, click 'Next'.
- In the Criteria list, select the option 'When any Log file monitoring agent is down' and click Next.
- Now, select the devices you want to get notified about and click Next again. Select the suitable options from the Time Window, Delayed Trigger and Recurring Trigger sections.
- Finally, provide a suitable name to the profile and click Save. You can also use the 'Test Action' option to check if the profile behaves as intended before saving it.
Q. How can I enable or disable Eventlog Monitoring?
You can enable or disable Eventlog for multiple devices using the Quick Configuration Wizard.
- Navigate to Settings → Configuration → Quick Configuration Wizard and click 'Event log rules'.
- Select a log file from the list, and a rule that you wish to apply from the dropdown provided. You'll see a list of devices that have this monitor associated already, and the other devices listed too. Choose which devices you want to associate the monitor to and move them to the associated devices list on the right by clicking the Right Arrow button.
- Click 'Save' to instantly associate the selected Eventlog monitor to these devices.
- To disable Eventlog for device(s) of your choice, follow the same process to select the log file and the rule. Once the list of associated devices are displayed, click the devices for which you want to stop Eventlog monitoring and move them back to the 'All devices' list by clicking on the Left Arrow button. You can also select multiple devices by holding down the 'Ctrl' key while you select devices ('Cmd' key for Mac).
- Click 'Save' once you're done to de-associate the monitor for the selected devices.
Q. How can I automate associating Eventlog Monitors to devices?
Discovery Rule Engine in OpManager can be used to associate Eventlog monitors to devices during discovery.
- Go to Settings → Discovery → Discovery Rule Engine and click 'Add Rule'.
- Provide a suitable name and the criteria to filter devices based on which OpManager will associate the rule to those devices. Tap 'Add' for every criteria you provide so that they get listed under the Criteria section.
- In the 'Action' section, select 'Associate a Event log monitor' from the first drop down, and select the suitable rule from the second dropdown and click 'Add'. If you want to perform more actions to these devices, you can proceed to add them here too.
- Finally. click 'Save'. From now on, devices that match the provided criteria will be associated with the Eventlog monitor(s) by default during discovery.
Q. How can I receive notifications for the generated Windows Event Logs?
- Go to Settings → Notification Profiles and click 'Add'.
- Select the mode of notification, provide the relevant details and click 'Next'.
- In the Criteria window, select the option that says 'When any Event Log Rules generates alarms'. This triggers notifications for all Eventlog alarms.
- If you want to trigger notifications only for some Eventlog rules, you can select those rules by clicking on the green 'Selected' button. Click 'Next' when you're done.
- In the next page, select the device(s) for which you wish to receive notifications for this rule and click 'Next'.
- Finally, provide suitable values for the Time Window/Delayed Trigger/Recurring trigger section and the profile name in the successive windows and click 'Save'.
Q. How can I monitor various processes running in a device?
OpManager's process monitoring allows you to have a look over all processes running in any of your network devices. To configure process monitoring templates:
- Go to Settings → Monitoring → Processes and click 'Add'.
- Select a device and suitable credentials to list all the processes running in it, and click 'Next'.
- Now all the processes running in that device are listed. Select the applicable processes and click 'Save' to save them as individual Process Monitoring templates.
- If you want to associate the templates to the devices right away, click 'Save and Associate' and in the following window, select the suitable devices and click 'Save'.
You can also associate process monitors to any device from its Snapshot page by clicking Monitors → Process monitors → Actions → Associate monitor.
Q. How can I automate actions like Start/Stop Processes in a device ?
You can use workflows to automate several actions in OpManager, including starting/stopping/testing processes. To set this up:
- Navigate to Workflow → Add Workflow.
- On the left pane under Process, you can find several Process-related actions such as starting, stopping, testing and listing all processes in a device.
- Select suitable actions, create a workflow and click 'Next step'.
- In the successive screens, provide the devices, the trigger for the workflow and a suitable name and other details, and save it.
Head to our documentation on Workflows to know in detail about automating actions in OpManager.
Q. How can I automate associating Process Monitors to device?
Using Discovery Rule Engine, you can automate association of process monitors as follows:
- Go to Settings → Discovery → Discovery Rule Engine and click 'Add Rule'.
- Add a name and the criteria to select which devices you wish to associate the process monitors to.
- Under Actions, select 'Associate a process monitor', select a suitable monitor and click 'Add'. Note that you can add multiple monitors and also create new process monitors from the same window.
- Once you're done providing all the details, click 'Save' to enable the rule right away.
Q. How can I receive notifications if any process is down or the threshold is violated?
You can configure notification profiles to be intimated on a medium of your choice when the process monitors raise any alerts.
- Go to Notifications → Add and choose a medium through which you want to be notified. Provide the necessary details and tap 'Next'.
- In the criteria window, select 'When any process is down or has violated a threshold'. This enables alerts for all process monitors configured in OpManager. To specify the processes for which you want notifications, tap the green 'Selected' button and select the applicable monitors. Click 'Next' when you're done.
- Select the devices to which you wish to associate this profile, and click 'Next'.
- Finally, provide a name for the notification profile and click 'Save'.
Q. How can I disassociate a Windows Service monitor from devices?
To disassociate a Windows Service monitor from several devices at once:
- Click Settings → Monitoring → Windows Services and click 'Associate' on the top-right corner. You can also click the 'Associate' icon under Actions column, next to the template of your choice.
- Make sure your template is selected properly, and on the right pane you can see the list of devices to which the monitor is associated.
- Select the devices which you want to disaasociate (select multiple devices at once using Ctrl+Click/Cmd+Click), and then click the Left Arrow mark to move them to the 'Available devices' column.
- Tap 'Save' to save these changes.
If you want to delete it from an individual device, you can also do it from the Device Snapshot page by clicking Monitors > Windows Service Monitors and tapping the 'Delete' icon next to the monitor you want to disassociate.
Q. How can I automate actions like Start/Stop/Pause Windows Service in a device?
Using Workflows, you can automate actions like Start/Stop/Pause Windows Services.
- Click Settings → Workflows and tap 'Add workflow'.
- In the left pane, click 'Windows Services' and drag and drop the actions of your choice.
- Once you're done configuring the actions, click 'Next step' to provide the applicable devices, trigger and profile info for the workflow and click 'Save'.
Q. How can I automate adding Windows Service monitors to device(s)?
- Under Settings → Discovery → Discovery Rule Engine, click 'Add Rule'.
- Provide suitable criteria for filtering out devices which need the Windows Service monitor(s) associated to them. You can also provide multiple criteria and choose whether you want OpManager to filter devices that satisfy all/any of the criteria.
- Under Actions, select 'Associate a Windows Service Monitor', select the monitor that you wish to associate and click 'Add'.
- Once you're done providing the criteria and the actions, click 'Save' to start associating the monitor from the next discovery.
Q. How can I receive notifications if any Windows Service is down?
OpManager's Notification Profiles has an option to get you notified when any of the Windows Service monitors raise an alert.
- Go to Notifications → Add Profile.
- Once you select the mode of notification and provide relevant details, tap 'Next' to provide the criteria for the profile.
- From the criteria list, select 'When any Windows service is down'. To receive alerts only when a few Windows Service monitors are down, click the 'Selected' button and select the necessary Windows Service monitors.
- In the successive steps, provide the devices to be added in this profile, the trigger options, and a suitable name for the profile and save it.
Q. How can I remove a Service Monitor from multiple devices?
- Go to Settings → Monitoring → Service Monitors and tap 'Associate'.
- Select the monitor that you want to disassociate, and select the devices to move them from the 'Selected devices' column to 'Available devices'.
- Click the Left Arrow button to move them back, and click 'Save' to disassociate the monitor from those devices.
Q. How can I automate associating Service Monitors to a device?
- From Settings → Discovery → Discovery Rule Engine, click 'Add Rule'.
- After providing a suitable name and description, select the criteria to filter devices to which you want to add the service monitors.
- Under Actions, select 'Associate a service monitor' and select the necessary service monitor from the next dropdown.
Q. How can I receive notifications if any service is down in a device?
To configure a notification profile for receiving alerts when a service is down:
- Under Settings → Notification Profiles, click 'Add profile'.
- After choosing the mode of notification and providing necessary details, click 'Next' to go to the Criteria window.
- From the list, enable 'When any service is down' to receive alerts for all services. To specify which services you want to receive the alerts for, click the 'Selected' button.
- Provide the device and trigger details in the successive windows. Finally, provide a name for the profile and tap 'Save' to enable it right away.
Q. How to add a VoIP Monitor?
The source and the destination devices should be IP SLA enabled Cisco devices. Make sure to discover the source device in OpManager and configure the correct SNMP credentials (with read and write community). To add a new VoIP monitor,
- Go to Network -> IPSLA -> VoIP Monitor and click on Add VoIP Monitor.
- Enter the name of the monitor and select the source device and interfaces from the list of devices that are already discovered in OpManager.
- Specify the source port and the IP address of the destination device. The destination device should be a IP SLA responder enabled Cisco device.
- Save the details and wait for OpManager to complete the configuration.
The collected data will be updated after every poll.
Q. How does VoIP monitoring work in OpManager?
OpManager primarily relies on Cisco's IP-SLA for monitoring the VoIP and the prerequisite therefore is, that the device should be a Cisco Router and must have IPSLA agent enabled on it. From IOS Version 12.3(14)T all Cisco routers support monitoring of VoIP QoS metrics. Cisco's IPSLA, an active monitoring feature of Cisco IOS software, facilitates simulating and measuring the above mentioned parameters to ensure that your SLAs are met. Cisco IP SLA provides a UDP jitter operation where UDP packets are sent from the source device to a destination device. This simulated traffic is used to determine the jitter, the round-trip-time, packet loss and latency. This data is gathered for multiple tests over a specified period to identify how the network performs at different times in a day or over a few days. The VoIP monitor gathers useful data that helps determine the performance of your VoIP network, equipping you with the required information to perform network performance assessment, troubleshooting, and continuous health monitoring.
Q. How to add a WAN RTT monitor?
The source device (Cisco device with IPSLA agent enabled) should be discovered in OpManager and properly configured with the correct SNMP credentials. For example, if you want to monitor the latency and availability of the branch office from your main office, you will need to have an IP SLA agent enabled Cisco router in your main office and this router should be discovered in OpManager. To add a new WAN RTT monitor,
- Go to Network -> IPSLA -> WAN Monitor and click on the Add WAN Monitor option on the top right corner.
- Enter the name of the monitor.
- Select the source device and the relevant interface(s) from the available list.
- Under Destination IP, enter the IP address of your destination device. (It is not necessary to have the destination device added to OpManager)
- Save the details and refresh the page to find the newly created WAN Monitor.
The data will be collected and updated after every poll.
Q. How to disable Switch Ports?
If you want to administratively disable an interface, it is possible with OpManager in just a few clicks. Here are the steps:
- Go to the required snapshot page of the interface that you want to disable.
- Under Interface tab, click the Disable button.
The interface gets disabled and the interface's status is changed to Down. To enable the interface again, go to its snapshot page and click the Enable button under the Interface tab.
Q. How to configure thresholds for multiple interfaces?
You can configure thresholds for multiple interfaces of the same type by editing the relevant interface templates.
- Go to Settings > Configuration > Interface Templates > Interface Types.
- Click on an Interface to open its Threshold details.
- Modify the threshold and click Save and Apply.
- You can now apply the modified threshold to all interfaces of this type (say Ethernet), or apply to few chosen interfaces. You must select the appropriate option here to apply the threshold changes.
Q. How to monitor the services running in the secondary IP address of the server?
You can modify the IP Address to look at from the database, so that OpManager uses the secondary interface to monitor the service running on this interface alone.
Here is the procedure to do this.
1. Connect to mysql database using the following command:
cmd> cd [OpManagerHome]\\mysql\\bin
cmd> mysql.exe -u root -P 13306 OpManagerDB
2. Use the mysql update command to change the IP address to look at:
mysql> update InetService set TARGETADDRESS=1.2.3.4' where TARGETADDRESS='5.6.7.8';
1.2.3.4 is the secondary interface of the device
5.6.7.8 is the primary interface of the device. OpManager should have discovered the device through this interface.
And update the TARGETADDRESS only for the interface on which a particular service runs.
Try using the following command:
mysql> update InetService set TARGETADDRESS='1.2.3.4' where TARGETADDRESS='5.6.7.8' and NAME='machine-name-or-ip-address_ServiceName_Portnumber';
where machine-name-or-ip-address refers to the machine name or ip address of the device to be monitored ( it is mostly the primary interface in case of ip address)
ServiceName is the name of the service to be monitored which can one among Web, FTP, Telnet, MySQL etc.. as specified under Services -> Monitoring --> Service Monitors
Portnumber is the port on which the service runs like 80, 21, 23, 3306 etc...
Q. How to monitor only select/specific VMs on a host?
You can monitor only the required VMs on a Host. OpManager discovers all the VMs during the initial discovery and lists them under the inventory in the host snapshot page. Click on the relevant icon to monitor the required VMs on the host. OpManager maintains this configuration when a HA, vMotion, or rediscovery happens.
Q. How do I check if my device is RFC1213 or RFC2096 compliant?
Use the Mib Browser from the Admin tab or the MibBrowser.bat/sh utility in /opmanager home/bin folder to check the compliance. Select RFC1213 or RFC2096 from the dropdown and then select your device. RFC1213:
- Expand org | dod | internet | mgmt | mib-2 | ip
- Select ipAddrTable
- Click the "Table" button
If the device does not support this OID, it will error out. RFC2096:
- Expand ip | ipForward
- Select ipCidrRouteTable
- Click the "Table" button
If the device does not support this OID, it will error out. If you do not see a MIB for RFC2096, you can download and upload it into OpManager. Google will provide a link to the MIB or check for its availability in http://oidview.com.
Q. How to monitor temperature on Cisco 2960 Switch?
The SNMP OID that returns temperature on Cisco devices is .1.3.6.1.4.1.9.9.13.1.3.1.3.1. Not all catalyst devices support this. This variable is implemented in CISCO-ENVMON-MIB. Load the mib in the MibBrowser and check if the device responds to a query to this variable.
Q. How to add Active Directory monitors in OpManager?
OpManager identifies the Windows server as a DomainController during the initial SNMP-based discovery. Based on the SNMP response, it automatically classifies the device under the Domain Controller category and is grouped under the map of the same category. Upon classification as a DC, the DC gets added with the AD dashboard. If it has correct WMI credentials, all the AD dashboard monitors will automatically populate the values. In your case, since the device is already discovered, enter the correct WMI credential and manually change the category to Domain Controller.
How to enable SLA responder on a monitored device?
Open a CLI session on the destination router and enable the EXEC mode as follows:
Router>enable
Start the global configuration mode:
Router#configure terminal
Enable the IP SLA responder:
Router(config)#ip sla responder
Router(config)#ip sla monitor responder
(Note: Enter any one of the command to enable IP SLA responder as it varies according to the IOS versions.)
Repeat the above steps for all the destination routers on which you want to monitor VoIP performance.
Q. How to configure call settings?
Define a template with the required VoIP settings to be used for monitoring performance. The VoIP template comes with pre-populated default values. Incase you would like to effect some changes to the values before initiating monitoring, make the changes as follows:
- Mouse-over Maps tab and click VoIP Monitors.
- Go to Settings-> Call Settings.
- Configure the following parameters:
- Destination Port - Specify the VoIP UDP port to which VoIP Monitor sends simulated traffic to generate performance metrics. The default port number is set as 16384. You can specify a port in the range of 16384 - 32766.
- Simulated VoIP Codec - The VoIP jitter codec decides the type of traffic that VoIP Monitor simulates over your network.
- Operation Frequency - The operation frequency is the frequency with which QoS metrics are collected by the IP SLA agent on your network to determine performance.
- Operation Timeout - The operation timeout is time to wait for the response from the responder / destination device in msecs.
- Type of service - The Type of Service octet allows you to set precedence levels for VoIP traffic of the IP SLA operations.
- MOS Advantage Factor - The advantage factor is a measure, on a scale of 0 to 20, of the willingness of your VoIP network users to trade call quality for convenience
Defining Thresholds for the monitored parameters: You can define a threshold template so that the VoIP performance parameters can be better suit your company SLA's (Service Level Agreements). Alerts are triggered based on the thresholds configured so that you can take corrective actions in time. Here are the steps to define a threshold template:
- Mouse-over Maps tab and click VoIP Monitors.
- Go to Settings->Threshold Template.
- Configure the following values:
- MOS Threshold : Configure the MOS threshold by specifying the upper and lower MOS range values in the range of 1 to 5.
- Jitter Threshold : Configure the jitter threshold in msecs with upper and lower threshold limits. The range is from 0 to 6000 msecs.
- Latency Threshold : Specify the delay allowed in msecs again in the range of 0 to 6000.
- Packet Loss : Specify the number of packets that can be lost in transit.
- Notification Profile : Select the required notification profile(s) in order to notify when the any threshold rule is violated.
Q. How to monitor a shared folder?
To monitor the folder on both local or remote server you should specify the path as follows: Drive:\FolderName ( Example C:\FolderName )and you can view our File & Folder monitor
More details in the User Guide:
File monitor http://help.opmanager.com/file_monitoring_templateFolder monitor http://help.opmanager.com/folder_monitoring_template
Q. How to add a custom dial graph for a custom monitor?
To create a custom dial graph, please follow the below steps. Lets take your scenario, where you want to point the custom monitor to the dial graph for a Firewall device. Here are the steps.
1. Open the file opmanager_snapshot_dial.xml and scroll to Firewall section.
2. Add PARAM type and pollKey for each dial names. where, PARAM type is the device type. eg: Juniper pollKey is the custom monitor name. eg: JuniperCPU Similarly you can do this for other device types like Servers, etc.. Replacing the custom monitor to the Pollkey can point the monitor value to the dial graph
3. I have added a custom monitor called JuniperCPU.
For eg:
<CATEGORY name="Firewall"> <DIAL name="CPUUtilization" displayName="webclient.devices.details.cpu" dialType="meter" shortKey="CPU"> <PARAM type="sonicwall" pollKey="CPUUtilization"/> <PARAM type="Juniper" pollKey="JuniperCPU"/> <PARAM type="Fortigate" pollKey="FortigateFirewallCPUUtilization"/> <PARAM type="Netscreen" pollKey="NetscreenFirewallCPUUtilization"/> <PARAM type="Cisco PIX" pollKey="CiscoFirewallCPUUtilization"/> <DEFAULT pollKey="CPUUtilization"/> Similarly, you can add the entries for DISK and Count Utilization.
4. Save the file and Restart OpManager to take effect.
Note: Backup opmanager_snapshot_dial.xml before modifying. Similarly you can associate custom monitor for other categories like Server,Routers etc.
Q. How to manage devices using the DNS name?
OpManager supports DNS environment. If the device is added with DNS name, all the queries will be sent only to the name and not IP. We can configure OpManager to poll only by name and not by IP address. Open serverparameters.conf under /OpManager/conf in a wordpad and find this entry PING_USING_IPADDRESS true change it to PING_USING_IPADDRESS false
Restart OpManager. Try adding one such device using Admin-->add device(use DNS name).
Q. How to troubleshoot WAN latency issues?
When you configure a WAN RTT monitor, OpManager starts collecting data every 5 minutes. At each poll, if the latency and availability threshold values are violated, OpManager triggers an alarm. After 5 minutes, if the latency threshold of the monitor is violated, an alarm is listed in the WAN RTT Monitors dashboard.
- Go to the WAN RTT Monitors dashboard to see the Least Performing Paths, Least Available Paths, and Recent Alarms table. If there is an alert, it is listed in the Recent Alarms table. Click on the severity image to get to the root cause.
- To know the root cause of the problem click on the severity image of the alarm. This gives you the hop-by-hop round trip time details(refer the below image). From this you can identify the exact hop which has problem.
- To know the availability, round trip time History (latency), SLA violation trend, and path hop round trip time trends for any monitor, click on all monitors tab and click on path link for the monitor for which you want to see the details. You will see the detailed statistics of that monitor for last 12 hours.
- To know the health of the monitor for the last 12 hours for every hour, go to WAN RTT Monitors -- All Monitors. The status of all the monitors are seen here., i.e. good, critical and unknown for last 12 hours. If there is any threshold violation for a monitor at a particular hour then the status of the monitor for that hour will be shown as critical(red). Now move your cursor over the status image and click on the image you will get the reason for that critical severity and all hops latency details to troubleshoot the problem. If there is no threshold violation, the severity is shown as good(green).
- To see the detailed reports of each monitor, go to Reports -- WAN RTT Monitors. Here you will find top latency reports, top availability reports, SLA violation reports with export and schedule options.
Q. How to add a WAN monitor using snmp v3 with write permissions?
OpManager does not support SNMP V3 for WANRTT yet.
We have plans to use only the read community for WANRTT configuration (Import option for the existing monitors using read community which is also under development phase). OpManager uses SNMP write to configure IPSLA (WAN RTT)settings in the source router. Though it is similar to "Write" command, some models(IOS versions) do not work with this. So once you configure a new WAN RTT monitor, login to the source router and run "write" (or equivalent command in new versions).
Q. How to monitor Latency between devices, say for instance, between the border routers to the dslams. Is it possible?
You can use our WAN RTT Monitor add-on to monitor the latency of end routers.
We use Cisco IP SLA to monitor the latency and raise alerts based on the thresholds you configure in OpManager. To know more about Cisco IP SLA, look at the link given below: http://www.cisco.com/en/US/docs/ios/ipsla/configuration/guide/ The WAN RTT (Round Trip Time) Monitor will help you,
a) Monitor latency between end points across WAN
b) Raise alerts based on the Round Trip Time thresholds. The thresholds are customizable.
c) Monitor Latency for each HOP between the end points.
d) Custom reports to identify the problem quickly.
e) Auto-Configuration of Cisco IP SLA monitors to the router, without having you to log on to the router.
Q. How to enable https on ESX servers?
You can use our WAN RTT Monitor add-on to monitor the latency of end routers.
We use Cisco IP SLA to monitor the latency and raise alerts based on the thresholds you configure in OpManager. To know more about Cisco IP SLA, look at the link given below: http://www.cisco.com/en/US/docs/ios/ipsla/configuration/guide/ The WAN RTT (Round Trip Time) Monitor will help you,
a) Monitor latency between end points across WAN
b) Raise alerts based on the Round Trip Time thresholds. The thresholds are customizable.
c) Monitor Latency for each HOP between the end points.
d) Custom reports to identify the problem quickly.
e) Auto-Configuration of Cisco IP SLA monitors to the router, without having you to log on to the router.
Q. How to enable SNMP on ESXi 4.0?
Follow the detailed instructions provided in the link below:
http://www.vmware.com/pdf/vsp_4_snmp_config.pdf
Q. How to enable SNMP on ESXi 4.1?
Intructions to enable SNMP on ESXi 4.1 using remote CLI are available in the link below:
http://www.fatmin.com/2010/08/enabling-snmp-in-esxi-41-using-the-remote-cli.html
Q. How to configure negative thresholds for bulk monitors (multiple monitors at a time)?
To configure thresholds for multiple monitors at once, you can use the Quick Configuration Wizard. Go to Settings → Configuration → Quick Configuration Wizard and select Threshold Settings. After providing the necessary filter criteria (Monitor type, Protocol, Category and Filter by), all applicable monitors will be listed. You can choose multiple monitors and click "Configure" to configure negative thresholds for the selected monitors.
Q. How to import/export script monitoring templates?
The import/export template option is useful when you want to share a custom template you created with the community or import a template from the community.
Exporting templates:
- Go to Settings → Monitoring → Script Templates. You'll see a list of templates. Here, do you see an 'export' icon against the template name?
- Click the Export template icon so that it is exported and saved in a location you select.
If you want to share it with the community, for now, you can post it on our forums, or email it to us. You can also upload it via this form.
Importing templates:
- Download the required templates to your local machine.
- From Settings -- Monitoring -- Script Templates screen, click on the Import link to browse and import the templates.
Q. How to associate script monitoring templates to multiple devices?
To associate the templates,
- Go to Settings -- Monitoring -- Script Templates.
- Click the 'Associate' icon against the template name. A list of devices for which the template can be associated, is shown.
- Select the required devices and move them to the right and associate.
Q. How to add script monitors to individual devices?
- Go to the device snapshot page.
- Scroll down to the monitors section
- Click on Script monitors. You will find a link on the right column to add monitors. Click and proceed to add monitors.
Q. How to alert when a particular AD account credentials are used with the server or service it used?
There should be a Security Event generated when that AD account logs in. We can create an EventLog rule and in the match string, give the account name for the exact filter. Follow the steps below:
- First, create a WMI credential profile from Settings → Discovery → Credentials → Add Credential.
- Next, you'll have to create and associate an Eventlog rule to the credential. Follow these steps to create a Eventlog monitor.
- Now, to associate that Eventlog monitor to several devices at once, go to Settings → Configuration → Quick Configuration Wizard and click on "Event log rules".
- Select the logfile and the suitable rule. In the following window, select and add the device(s) that you wish to associate the rule to, and click "Save".
Q. How to change the threshold to only alert if a device is not reachable for 15 minutes or over?
You can change this setting by changing the Availability Interval of any device. In the Snapshot page of any device, click on "Edit device details" under Device Summary, or go to Menu → Availability Monitoring and select the desired polling interval value for the device.
Q. How to use script monitoring to query values from a database and alert based on the value returned as the query output?
OpManager script monitoring provides a lot of flexibility to achieve some network monitoring tasks which is otherwise not available in a solution out-of-the-box, or even with integrated solutions.
Usecase
This usecase demonstrates how OpManager uses Script monitors to find the sum of the values of two monitors on a monitored database server and alerts if the collective size exceeds a certain threshold. The monitor by default returns multiple instances (SQL instances on a DB server), and this usecase derives a sum of the size of two specific instances. You can extend the same procedure to perform several other tasks my querying a database (in this example, the opmanager database) through a script.
Prerequisites
MySQL .Net connector: http://dev.mysql.com/downloads/connector/net
The custom script
Attachment:CPU Util Sum.xml
Here is the video capture leading you through a step-by-step configuration:
If you are unable to view the embed above, visit this link: https://www.youtube.com/watch?v=0BB4uvc8i1k
Q. How to remove a custom SNMP monitor?
- Navigate to the device template to which the new custom monitor was added, from Settings → Configuration → Device Templates.
- Click on the template, scroll to the custom monitor you wish to delete and click the Delete icon next to it under 'Actions' column.
Q. How to monitor DHCP scope?
The DHCP scope monitoring OIDs are present in the DHCP mib.Hence the following DHCP mib and MSFT mib has to be placed in the OpManager\mibs folder.Find them attached in this KB article.
The OIDs are .1.3.6.1.4.1.311.1.3.2.1.1.3 for FREE IPs and .1.3.6.1.4.1.311.1.3.2.1.1.2 for IN USE IPs in a network address
Verifying the OIDs
Run the mibbrowser.bat in the OpManager\bin folder and load the DHCP mib.
Fill the details of the HOST,community with the details of the DHCP server
Paste the OID for FREE IPs in the ObjectID field and click on Operations -> Get
If you get the output of the FREE IPs available in every network in the DHCP pool,create custom SNMP monitors using the procedure in the how-to link below
https://www.manageengine.com/network-monitoring/custom-SNMP-monitors.htm
As you can see the OIDs above are numeric as well as tabular hence they give output for multiple networks in every poll.
Updating changes in Database
Once you have created the SNMP monitors (Free IPs and IN USE IPs) in the Windows template and applied it to servers,type the following in the browser
http://OpManager server:port/SubmitQuery.do
Paste and run the following query after inputting the DHCP server name and DHCP monitor name.
update polleddata set saveabsolutes='true' where name like '%DHCP monitor name%' and agent like '%DHCP server name%'
For example :
update polleddata set saveabsolutes='true' where name like '%DHCP FREE IPs%' and agent like '%fscvopdhcp01%'
Repeat the same procedure for DHCP IN USE IPs monitor as well.
Note: Please make sure you backup OpManager before running the above query.
Attached Files :
DHCP Scope monitor.png 85.85 KB
I still have some questions which needs clarification!
If you have any questions about OpManager, feel free to raise a support request and we’ll get back to you.
Q. How to dissociate a performance monitor from device(s)?
- Navigate to Settings -> Monitoring -> Performance Monitors.
- Click on the associate icon found under the Action column of the monitor you want to dissociate from devices.
- You can now filter them based on criteria such as Vendors, Business views and Groups.
- Devices associated with the monitor will be listed down under the selected devices column.
- Select the devices you want to dissociate and then move them from the "Selected Devices" column to the "Available devices" column.
- Enable the "Do you want to dissociate the monitor" checkbox.
- Click "Apply" or "Apply and overwrite".
- The monitor has now been successfully dissociated from the devices.
NOTE: Dissociation is applicable only for individual monitor-specific operation and not during bulk monitor updation.Q. How to associate a monitor based on various categories?
- Navigate to Settings -> Monitoring -> Performance Monitors.
- In case of individual monitor association, click on the associate icon found under the Action column of the monitor you want to associate to devices. In case of bulk association, click on the Associate option found in the top right corner of the page and select the monitors you want to associate for devices.
- In case of monitor-specific association in OpManager central, select the "Associate to devices" option. For monitor association from OpManager Central, refer here.
- You can filter them based on their vendor, the business view they belong to or the group they cater for.
- Devices not associated but can be associated with the monitor will be listed under the available devices section. Select the devices you want to associate with the monitors and then move them to the "Selected devices" section.
- Click on "Apply" or "Apply & Overwrite" based on your preference. The monitor will now be successfully associated with the selected device(s).
NOTE: The monitor will be associated to the device only when the corresponding protocol is enabled on the device.Q. How to associate a monitor to probe and its devices from OpManager central?
- Under OpManager Central, Navigate to Settings -> Monitoring -> Performance Monitors.
- In case of individual monitor association, click on the associate icon found under the Action column of the monitor you want to associate to probes.
- Select the "Associate to Probes" button at the top.
- Now, select the probes you want to associate to the monitors from the "Available Probes" section and move them to the "Selected Probes" category and then click on "Apply and Overwrite".
- In case of bulk association, click on the Associate option found in the top right corner of the page and select the monitors you want to associate to the devices in any of the probes. You can then later filter the devices based on their vendor, the business view they belong to or the group they cater for.
- Now, select the Vendor and Probe. The corresponding devices will be listed down under the "Available Devices" category. Move the required devices to the "Selected Devices" category and then click on "Apply" or "Apply and Overwrite".
- The monitor(s) will now be successfully associated with the selected device(s)/ Probe.
NOTE: Kindly note that associating monitors to probe will not make changes to the existing configuration of the devices associated with the probe. On the other hand, associating monitors to devices will associate the monitors directly to the devices. In case the specific monitor does not exist within the probe, the monitor will automatically be added to the probe too.Q. I have a bunch of serial numbers of my devices. How to add them to devices?
Create a CSV file and add all the custom field information including the serial numbers of your devices. Go to Settings > Configuration > Custom Fields > Import values > upload the CSV file. The updated changes can be viewed from the individual device snapshot page under the Custom Fields section.
Q. How can I start/stop monitoring a server related to a IPMI device?
To start monitoring a server belonging to an IPMI:
- Navigate to the IPMI Device Snapshot page and click on the green "Start monitoring" icon next to the server you wish to monitor, under the "Managing servers" section.
- Proceed to provide the device name/IP address of the server, select the applicable credential profile(s) and click 'Discover'.
- If the server is already available in OpManager, it will automatically get mapped to the IPMI device once you click 'Discover'. If not, clicking this button will discover the device into OpManager and map it to the IPMI device.
Q. How can I disable monitoring for a sensor in OpManager?
Select the sensor(s) you wish to disable monitoring for, and click on Actions → Unmanage. This action stops OpManager from monitoring that sensor and permanently disables all alarms from the selected sensors.
Q. How can I update the internal IP address/public NAT IP address of the OpManager server to the agents?
In general, the IP address of the OpManager server is automatically updated to the agents whenever the OpManager service restarts. So, there will not be a need to manually update the new IP address every time to all the agents.
But sometimes, there might be communication issues between the server and the agent since OpManager's internal IP address is not freely accessible from agent-installed devices outside of your network and only the public NAT IP address is accessible. Sometimes even within your network, communication issues might result in the server IP not being updated properly to the agents.
In that case, you can manually update the server IP in your agent(s) in two ways:
- From the Registry Editor on the agent-installed device:
- Go to the Registry Editor (Start > Run > regedit) and go to the following path:
Computer\HKEY_LOCAL_MACHINE\SOFTWARE\WOW6432Node\ManageEngine\OpManagerAgent\ServerInfo
For devices with a 32-bit operating system, the path would be:
Computer\HKEY_LOCAL_MACHINE\SOFTWARE\ManageEngine\OpManagerAgent\ServerInfo - Update the new public IP address in the "serverflatname" field and click Save.
- Go to the Registry Editor (Start > Run > regedit) and go to the following path:
- From the OpManager Agent Tray icon: Right click on the OpManager Agent Tray icon and under Server Configuration > Server Primary IP, update the new public IP address of the OpManager server.
- Once the above said changes are done, restart the ManageEngine OpManager Agent service in Services to apply the changes.
Q. How can I monitor occurrence of multiple strings in the file content for log file monitors in OpManager?
In the File Content field for File monitors in OpManager, you can use Regular Expressions (RegEx) to specify multiple search criteria for the files that need to be monitored.
For example, consider "error", "critical" and "warning" as 3 search strings. If you need to monitor a log file and raise alerts if any of these keywords are found in the file, you can simply use the RegEx (error)|(critical)|(warning) to raise alerts for this monitor. Similarly, you can customise this RegEx pattern to suit your requirements and monitor any combination of strings using the File monitors.
Q. How can I disable monitoring for a sensor in OpManager?
Select the sensor(s) you wish to disable monitoring for, and click on Actions → Unmanage. This action stops OpManager from monitoring that sensor and permanently disables all alarms from the selected sensors.
- Templates
- How to apply a windows service monitor to several devices?
- If I delete a category, will it affect the already associated devices?
- How to import a new template obtained from ManageEngine Support or Community or a OpManager setup in different location?
- How to classify two devices having same SysOID's into two separate Device Templates?
- How to classify devices under the correct device type using templates?
Q. How to apply a windows service monitor to several devices?
You can associate a Windows service monitor or a TCP service monitor to several devices using the quick configuration wizard.
- Go to Settings -- Configuration -- Quick Configuration Wizard -- Add a new service monitor to several devices.
- Select Windows service monitor or the tcp service monitors option, and click next.
- From the list of services, select the service monitor that you'd like to associate and select the devices in the subsequent screen.
- Click Finish to associate.
Repeat process to associate other services to multiple servers.
- Security
- How to Regenerate SSL?
- How to scan a file that has been excluded from scanning?
- How to schedule my scanning in non business hours?
- How to manually scan my setup? Will it affect my default schedule?
- How to get in touch with our support team?
Q. How to Regenerate SSL?
To regenerate SSL in OpManager, go to Settings -> General Settings -> Security Settings and click on the edit button next to 'SSL Certificate Details'.
After which, follow the instructions here.
Q. How to scan a file that has been excluded from scanning?
You can always scan a file that has been excluded from scanning incase you change your mind.
- Head to the file integrity reports section by clicking on the "Reports" button.
- Now, Select the file you want to scan and change its action type by picking one from the "change action type" dropdown box.
Q. How to schedule my scanning in non business hours?
File integrity scans are carried out once every 24 hours by default. To schedule your scans during specific hours, click on the "settings" button and set your desired time under the "Execute at" option. By scheduling your scan, the scan will take place at the same time everyday.
Q. How to manually scan my setup? Will it affect my default schedule?
To scan your OpManager-installed directory, click on the "scan now" option near the most recently scanned on text that displays the date and time of your most recent scan at the left most bottom of your screen. Manually scanning your setup will not affect your default schedule in anyway. Your default scan schedule will be carried out as specified.
Q. How to get in touch with our support team?
You can always reach out to our support team via email by filling the support form. Kindly make sure that you have configured your mail server settings first. The from mail address is the address from which the mail will be sent to our support team i.e. your mail address. If the from mail address is not specified, the mail address mentioned in the mail server settings will be taken into account by default. If you want to send the mail to our support team from a mail address that has not been configured in the mail server settings, you can fill them out in the from mail address.
- Alarms
- How to configure Alarm Escalation Rules?
- How to suppress an alarm?
- How to avert false alerts?
- How to forward traps from OpManager?
- How to configure receiving of traps from the source router when monitoring WAN links?
- How to alert the administrator of a telnet to router or a switch?
- How to process traps for individual Access Points on a Wireless Controller?
- How to get uptime alerts?
- How to set diskspace alarms in OpManager?
- How to configure OpManager to send just one email to notify a missed poll (device down) and then cease emailing each missed poll thereafter?
- How to generate 'data not collected' alarms, i.e., get OpManager to alert when data collection stops?
- How to get OpManager generate alarms when data collection stops?
- How to disable alarms on ESX servers when a VM is powered off?
- How to email alarms?
- How to escalate an alarm to the person concerned via Email/SMS if the alarm is not cleared within a certain amount of time?
- How will a sensor alarm be raised, and how do sensor thresholds work?
- How can I suppress/unsuppress alarms of a sensor?
- How to get notified when alarms are cleared?
Q. How to configure Alarm Escalation Rules?
Prerequisite: Mail Server has to be configured. To configure Mail Server Settings, click here.
- Go to Settings > Configuration > Alarm Escalation Rules. Click on Add Rule
- On the window, enter a name for the alarm escalation rule and choose the alarm severity
- Choose the devices by category and filter devices by Groups or Business Views
- Specify a time window to escalate the alarm and to run this check
- Mark Exclude Acknowledged Alarms checkbox to escalate unacknowledged alarms only
- Provide the email address of the sender (as configured in the mail server settings) and the recipient
- Edit the mail contents as required (provide mobile number if SMS server has been configured)
- Click on Save
Q. How to suppress an alarm?
An alarm can be suppressed by three methods.
Device Specific:
- Under Inventory > Devices, click on the required device to go to the device snapshot page and click on the
 icon on the top right corner
 - Click on Suppress Alarms. Configure the required time period for suppressing the alarms and click on Save
Alarm Suppression for Group devices:
Settings Option
- Go to Settings > Configuration > Quick Configuration Wizard > Alarm Suppression
- In the wizard, filter devices based on Category, Business Views or Groups
- Choose the required time period and devices from the available list
- Click on Save
Inventory Page
- Under Inventory > Devices, select the required devices and click on the
 icon on the top right corner
 - Click on Suppress Alarms and choose the required time period to suppress the alarms and click on Save
Note: The suppressed alarm and the suppression time will be displayed on the device snapshot page.
Q. How to avert false alerts?
Here are a few things that you can do to avert false positives:
- Suppress Alarms for device: Its possible that you have pulled down some devices for maintenance or a device has crashed and may not be up any time soon. Tell OpManager to stop sending alerts for such devices. Go to the device snapshot page → Actions menu → Suppress Alarms and select the period for which you like the alarms suppressed.
- Set up thresholds:When configuring thresholds, specify the consecutive failure counts. For instance, if the poll interval is 5 mins, a device might not respond to a poll due to a transient spike leading to a 'down' alert. The subsequent polls will succeed and you will find 'clear' alerts. This erratic up-down alerts can be avoided by letting OpManager alert you after 3 consecutive polls.
- Configure device dependencies: If a router or a firewall is down, the devices behind these do not respond to polls resulting in unnecessary 'down' alerts. Configure device dependencies so that OpManager does not monitor a set of devices if the dependent device is down.
- Optimize Syslog Rules: The consecutive failure counts can be specified even when parsing syslogs. The advanced syslog configuration screen contains a field where you can indicate the number of occurrences.
Q. How to forward traps from OpManager?
Yet another frequently asked/discussed requirement is the ability to forward alarms in OpManager as traps to another trap destination. Requests are also raised to know if the incoming trap can be redirected to another application. YES, both are possible. Here is how you go about the forwarding:
Forwarding Traps
Here, OpManager simply forwards the SNMP Trap to another manager/device. Forwarding traps from OpManager involves a couple of configuration changes in two files. Refer the table below:
1. Effect the following configuration changes:
File name & path Existing entry Modified entry /opmanager/conf/trap.forwarder
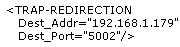
(replace with the correct
IP address and port)/opmanager/conf/trap.filters 
2. Save the file and restart OpManager.
OpManager starts forwarding the incoming traps to the destination IP address and the Port mentioned in the trap.forwarder file.
Forwarding OpManager Alarms as Traps
You might want to forward the alarms in OpManager as traps to another destination/trap receiver. Here is how you do it:
1)Ensure Net-SNMP is installed on the OpManager server.
2)Create a batch file sendtrap.bat to invoke the snmptrap command. Place this file in /opmanager folder. The syntax for this command is as follows:
snmptrap options hostname community trap parameters...
For Version 1, the required trap parameters are:
- enterprise-oid agent trap-type specific-type uptime objectID type value...
- The code snippet for this batch file is given below:
- snmptrap -v 1 -c public %1 .1.3.6.7.2.1.3.1 %2 1 6 10000 .1.3.6.7.2.1.3.1.1.2 s "%3,%4,%5,%6"
where
-v 1 The SNMP version -c The community string and the default SNMP community string is public %1 The manager name, viz., the hostname or the IP address of the manager that must receive traps. .1.3.6.7.2.1.3.1 Specify the appropriate enterprise OID %2 The agent-name, that is the hostname or the IP address of the device for which an alarm is generated. .1.3.6.7.2.1.3.1.1.2 Replace with the appropriate specific OID 1 The generic type number 6 The specific type number 10000 The sysUptime in milli-seconds s Refers to the data type of the OID (string type) "%3,%4,%5,%6"
(replace the % symbol with $ if you are doing it on a Linux box)
The message from OpManager that can contain one or more of the following variables:
- $displayName - the Displayname of the device
- $strModTime - the time when the alarm was generated
- $category - the category to which this device belongs to
- $severity - the severity of the alarm
- $message - the message of the alarm ( like Web Service Down or Threshold Violated ).
3)Configure a 'Run Program' notification profile specifying the following:
Command Name: sendtrap.bat
Program Arguments :[manager-name] $source $displayName $strModTime $category $severity $message
4) You can associate this notification profile to devices using the Quick Configuration Wizard. Whenever an alarm is generated on the managed devices, a trap is sent to the other monitoring server.
Q. How to configure receiving of traps from the source router when monitoring WAN links?
To receive alerts from the device, make sure you configure the routers to send traps to OpManager (you will not receive alerts from the device if the trap host is not configured in the source router). Telnet the router and type the following command:
snmp-server host (opmanager server IP) traps (host community string) rtr For instance, if the OpManager host IP Address is 192.168.18.128, and the community string is private, the command would be: snmp-server host 192.168.18.128 traps private rtr
Q. How to alert the administrator of a telnet to router or a switch?
This should be possible with Syslog monitoring.
https://www.manageengine.com/network-monitoring/syslog-monitoring.html
http://help.opmanager.com/add_syslog_rulesThe other option is to configure the router or switch to send a trap notification whenever a login occurs.
Q. How to process traps for individual Access Points on a Wireless Controller?
OpManager processes traps from devices into meaningful alerts.
Though the trap OID is the same, there must be some difference in the varbinds which shows the AP's names. OpManager can process that value (failure component) and create a new alarm for each Access Point. Refer to the following link for steps to know about trap processing in OManager.
http://help.opmanager.com/processing_traps
Q. How to get uptime alerts?
Many users get confused with 'sysuptime' from RFC1213 MIB, but it is not representative of the system uptime. It is the time in hundredths of a second since the network management portion of the system was last re-initialized.
You have to use hrsystemuptime to find the system uptime. You can add this as a new monitor to the existing device templates through Add Monitor -> Add Bulk option. [ Use the add bulk option to include mathematical expressions to the monitor ].
hrsystemuptime OID is ".1.3.6.1.2.1.25.1.1.0". You have to divide this by 8640000 to give the system uptime in days.
See the attached image to findout the expression to be used and the value that i got from this OID for an SNMP node.
To this, you can configure thresholds.
Q. How to set diskspace alarms in OpManager?
Make sure the right monitor is added for the server. Either WMI or SNMP, you have these set of monitors.
- Disk utilization(added during discovery)
- % partition details(added during discovery)
- Free disk space(MB/GB)
- Used Disk Space(MB/GB)
You can set thresholds for all the monitors and get the alert once it is violated.
Q. How to configure OpManager to send just one email to notify a missed poll (device down) and then cease emailing each missed poll thereafter?
As per the design OpManager triggers 3 alarms for the device down state - when it misses 1 poll (attention), 3 poll (trouble) or 5 poll (critical). It sends only one email notification based upon the option selected for when the Device misses poll(s) in the Notification Profile.
The following are the possible reasons for the multiple email notification,
a) Admin --> Alarm Escalation - Check whether you have enabled any Alarm Escalation for the device.
b) Notification Profile - Check whether you have enabled when the Device misses poll(s) on multiple notification profile and associated the device.Q. How to generate 'data not collected' alarms, i.e., get OpManager to alert when data collection stops?
Here are the steps to make OpManager send alarms when data is not collected:
- Open the file NmsProcessBE.conf under \OpManager\conf folder.
- Search for the entry "CLEAN_DATA_INTERVAL 999999".
- At the end of the line add the entry "GENERATE_DATACOLL_EVENT true".
For ex.
"CLEAN_DATA_INTERVAL 999999 GENERATE_DATACOLL_EVENT true" - Save it and restart OpManager.
Q. How to get OpManager generate alarms when data collection stops?
OpManager can be configured to send 'Data not collected' alerts when monitoring and data collections stops for some reason. This requires a little tweak to a configuration file. Here are the steps:
- Open the file NmsProcessBE.conf under OpManagerconf folder.
- Search for the entry "CLEAN_DATA_INTERVAL 999999".
- At the end of the line add the entry "GENERATE_DATACOLL_EVENT true".
- For example:
CLEAN_DATA_INTERVAL 999999 GENERATE_DATACOLL_EVENT true" - Save it and restart OpManager.
'Data not collected' alarms is now generated when data collection fails for some reason.
Q. How to email alarms?
Users can send alarm details as an email message in OpManager.
- Navigate to Alarms tab in OpManager.
- Select the required alarms.
- Click on the menu icon on the top right corner.
- Click on the action Send Email.
- Enter the details of From mail id, To mail id, Subject and Message.
- Finally click on Send.
Q. How to disable alarms on ESX servers when a VM is powered off?
The powered off VM needs to be configured for alarm suppression to disable any further alarms. To configure alarm suppression, follow the mentioned action in OpManager : VM snapshot -- Actions -- Suppress Alarms, or Settings -- Configuration -- Quick Configuration Wizard -- Associate an Alarm Suppression rule to several devices.
Q. How to escalate an alarm to the person concerned via Email/SMS if the alarm is not cleared within a certain amount of time?
- Go to Settings -> Configuration -> Alarm Escalation Rules.
- Click on the 'Add Rule' button.
- Enter the 'Rule Name', select the severity of the alarm to be escalated, select Category of 'Server'.
- Select the time interval before which the alarm needs to be cleared to avoid being escalated and the time interval for the recurring check.
- Enter the Email address (and the email address from which the mail needs to be sent from) and/or Mobile Number (for SMS) of the person to whom the alarm needs to be escalated to if not cleared/acknowledged in the specified time period, along with the message that needs to be sent.
- Click on 'Save'.
Q. How will a sensor alarm be raised, and how do sensor thresholds work?
Alarms for sensors can be configured to be raised based on two types of criteria - based on the status of the sensor, and based on thresholds configured for the sensor.
- To enable alarms based on the sensor status, navigate to your IPMI device's Snapshot page and click on the Hardware tab.
- Under the Sensor info section, click the Edit icon next to the sensor you wish to enable alerts for.
- In the Edit Sensor window that is opened, enable the "Alert, if this sensor gets failed" option to enable status-based alerts. If this is unchecked, then OpManager will not raise alerts when the sensor's status changes. Refer this page to know various status messages available under IPMI and how alerts will be raised based on those statuses.
- To enable thresholds-based alarms, simply provide the necessary thresholds under the "Threshold details" section for the sensor.
Q. How can I suppress/unsuppress alarms of a sensor?
To suppress a sensor's alarms, navigate to the IPMI device's Snapshot page → Hardware tab → Sensor info section and click the "Suppress Alarms" icon next to the sensor you wish to suppress. The Suppress/Unsuppress options are also available under the Actions drop-down menu.
Q. How to get notified when alarms are cleared?
To get notified when alarms are cleared, when creating/editing a Notification Profile select the "Notify when the alarm is cleared" criteria in the criteria window.
- Maps
- How to configure Zoho/Google maps?
- How can I filter devices in Zoho/Google Map?
- How to delete a device from Zoho/Google map?
- How can I create a 3D floor view?
- How can I view the QR code for a device in a rack?
- How to export Layer 2 maps to Visio?
- How to monitor Layer2 unrouted VLAN traffic?
- How to edit the link or device positions in layer 2 map?
Q. How to configure Zoho/Google maps?
A. Both Zoho Maps and Google maps are available in the Maps section (Maps > Maps). In the toggle switch, choose Zoho Maps/Google Maps.
- Zoho Maps: This comes with the product and available free of cost. Zoho maps requires no configuration to be done and works out of box.
- Google Maps: Google Maps on the contrary needs to be configured. To do this, you need an API key that can be obtained from Google. Instructions to configure Google Maps can be found here.
Q. How can I filter devices in Zoho/Google Map?
A. Go to Maps > Maps and click on the dialogue box in the top right corner to access the Filter by Type feature. Select the device type by which filter has to be applied.
Q. How to delete a device from Zoho/Google map?
A. Go to Maps > Maps and click on any existing device on the Map (Zoho/Google). Click the Delete button and press Ok on the popup to delete the device from the Map.
Q. How can I create a 3D floor view?
A. Go to Maps > 3D floor views. Click on Create New to create a 3D floor view.
Q. How can I view the QR code for a device in a rack?
A. Go to Maps > Rack Views. Click on the required Rack and click on the QR code icon on the top right corner of the screen. Specify the values for width, height and devices per row and click Generate. The QR code will be generated and displayed in a pop up window. You can print this QR code / save it as PDF.
Q. How to export layer 2 maps to visio in OpManager?
Any layer 2 map discovered in OpManager can be exported into Microsoft Visio. Visio uses simple graphics and layouts to represent flowcharts and decision diagrams and are also used for network diagramming. This export process is greatly simplified by the introduction of an exclusive add-on. Learn More
Q. How to disable alarms on ESX servers when a VM is powered off?
The powered off VM needs to be configured for alarm suppression to disable any further alarms. To configure alarm suppression, follow the mentioned action in OpManager : VM snapshot -- Actions -- Suppress Alarms, or Settings -- Configuration -- Quick Configuration Wizard -- Associate an Alarm Suppression rule to several devices.
Q. How to edit the link or device positions in layer 2 map?
This can't be edited. However, you can save it as a Business View and edit/modify the device and link positions.
- Dashboard and Business views
- How to embed widgets into other webpages?
- How to use Business Views for VoIP monitoring?
- How to create new dashboards?
- How to delete a dashboard?
- How to add new widgets?
- How to create and embed NOC view?
- How to view Applications Manager dashboard in OpManager?
Q. How to embed widgets into other webpages?
OpManager lets you create powerful dashboards with over 90 widgets to choose from. The widgets display different fault and performance data with provision to drill-down. To know your network health at a glance, all you will need is a quick look at your favorite network management console , OpManager :)
We have had a few users asking us in our forums or writing to us at support to know if OpManager widgets can be embedded into their web pages. Yes, OpManager provides the flexibility of embedding widgets or dashboards into a web page, making it easier for a user or a group to access a specific set of information without having to log in and log out every time.
You can embed a widget or a dashboard using an <iframe>. For the benefit of those who have not seen the procedure posted in our forums, here are the steps:
Embedding a Widget
The code snippet to embed a widget is given below:
<iframe src="http://OpManagerServerName:Port/generateWidget.do?widgetID=194&widgetWidth=520" width=520 height=400 frameborder="1" scrolling="no">
In the above snippet, replace the src name with the actual host name and the port number on which OpManager is hosted and the ID of the widget that you want to embed. Mouse-over the edit icon on the top right corner of the widget to see the ID.
Embedding a Dashboard
You can embed the default dashboards or create a new dashboard and embed.
Here is the snippet to embed a dashboard:
<iframe src="http://OpManagerServerName:Port/customDashboard.do?methodCall=showCustomDashboard&dashboardID=303" width= height=in_pixelsin_pixels frameborder="1">
The snippet to access the dashboard without having to log-in every time is:
<iframe src="http://OpManagerServerName:Port/customDashboard.do?methodCall=showCustomDashboard&dashboardID=303&reqUserName=guest_user&reqPassword=guest_password" width=in_pixels height=in_pixels frameborder="1">
where the user name and password are passed as additional arguments.
Replace the user name, password and the dashboard ID. Access the required dashboard from the WebClient to see the ID passed in the url.
Q. How to use Business Views for VoIP monitoring?
In VoIP Monitor, business views help you to know the status of the device and call path between devices at a glance. Whenever a new VoIP monitor is created, a business view (image shown below) of it also gets created automatically with the default background and device icons. However, later you can modify the background and device icons if required.
In the business view, mouse-over the device icon or name/IP and call path to view its details. Click on the device icon or call path will open the snapshot page of the device or the call path respectively.
Accessing VoIP Monitor Business Views
- Mouse-over Maps tab and select VoIP Monitors
- Click Business Views.
- Select the required business view from the drop down menu available on the top the business view displayed.
Q. How to create new dashboards?
From Home --> Dashboards --> Custom --> click on Create New Dashboard, or alternatively click on the green 'Create/edit Dashboard' button on the top right. Configure the following details:
- Name: Enter a unique name for the dashboard. Description: Brief description about the dashboard. Click 'Next'.
- Widget List: Select the Widgets that you want to be displayed in the dashboard and click 'Next'.
- Select the users you want to associate this Dashboard to.
- Click the Create button.
Q. How to delete a dashboard?
The default dashboards in OpManager cannot deleted. You can delete the custom dashboards. Here are the steps:
- Mouse-over Dashboards tab and click on the name of the Dashboard that you want to delete. The dashboard opens.
- Now click on Actions menu and select Delete. A confirmation window pops-up.
- Click OK to confirm deleting.
Q. How to add new widgets?
To add a new widget to a dashboard follow the steps given below:
- Go to the relevant Dashboard
- Click on Actions drop down menu and select Add Widgets.
- Select the Widget(s) that you want add to the dashboard.
- Click Add button to add the selected widget(s) to the dashboard.
To delete or edit a widget,
- Click on the drop-down icon available on the widget box and select Delete. A confirmation window pops up.
- Click OK to confirm deleting.
How to create and embed NOC view?
To embed a NOC view link, follow the steps below:
- Go to the Dashboard page and click NOC Views on the top right.
- Click the Embed icon present next to the NOC Name. The Embed link will be displayed.
- Click the link to copy it to your clipboard. The NOC Embed link is ready to be shared.
- Click the Regenerative Private link icon present towards the bottom of the Embed link box to generate a new embed link. This will deactivate the embedded link generated previously.
Learn more here.
How to view Applications Manager dashboard in OpManager?
To view the Applications Manager dashboard in OpManager, go to Dashboard -> Servers -> Applications.
- Reports
- How to configure custom business hours?
- How to mark a report as favorite?
- How to schedule a report from Reports page?
- How to schedule device specific reports?
- How to generate Traffic and Utilization report for a set of interfaces?
- How to generate report from inventory page for devices?
- How to mail a report?
Q. How to configure custom business hours?
- You can now Business Hour Rules in OpManager.
- Navigate to Reports-> Report Settings -> Business Hour Rules.
- Click on Add Rule.
- Provide a Name and Description.
- Select the time duration for each day from the drop down.
- Click on Save.
Q. How to mark a report as favorite?
- Go to Reports > OpManager and select the required report category (for e.g, Health and Performance)
- The reports are displayed in a table
- Click on the star icon on the left side of the required report. The report is added to My Favorites (or) Open the required report and click on the star icon on the top left corner. The reports marked as favorites can be accessed by Reports > OpManager > My Favorites
Q. How to schedule a report from Reports page?
Prerequisite: Mail Server has to be configured. To configure Mail Server Settings, click here.
- Go to Reports > OpManager
- Open the required report and click on More Actions on the top right corner
- Click on Schedule This
- Schedule Report window appears. Enter Schedule Name and provide the Email ID of the recipient
- Choose the devices from Category or filter devices based on Groups, Business Views
- Choose the Period, Time Window, Report Format and schedule a time for the report to be sent
- Edit the Mail Content as required and click on Save
Q. How to schedule device specific reports?
Prerequisite: Mail Server has to be configured. To configure Mail Server Settings, click here.
- Go to the Device Snapshot page for which the report is to be scheduled
- Click on the icon on the top right corner and click on Reports > At-a-Glance Report
- In the window, click on Schedule This on the top right corner
- Enter a name for the schedule, provide Email ID of the recipient
- Choose the Period, Time Window, Report Format and schedule a time for the report to be sent
- Edit the Mail Content as required and click on Save
Q. How to generate Traffic and Utilization report for a set of interfaces?
To make report generation more simpler and user friendly, OpManager lets you generate utilization, discards, traffic and error reports for multiple interfaces with ease. These reports can be customized to display interface data in the form of graphs and tables for custom time intervals.
To generate a traffic and utilization report for a specific set of interfaces,
- Go to Inventory -> Interfaces.
- Select a set of interfaces and click on the Generate Reports option on the top right corner.
- Select the Report type and the Time period for which the report has to be generated.
- From the available list, choose Rx Utilization, Tx Utilization, Rx Traffic and Tx Traffic monitors and click on Generate Report.
- A Report Builder page will be opened with the required data on traffic and utilization of the selected interfaces.
Graphs will have the data displayed with time in the x-axis and traffic/utilization in the y-axis. The Table view will have the minimum, maximum and average values of the traffic and utilization of all the selected interfaces individually.Q. How to generate reports from device inventory page?
- Naviagate to Inventory --> Devices.
- Select the devices.
- Click on Generate Report on the top right corner.
- Specify the Report Type, Time Period and choose the monitors.
- Click on Generate Report.
- The report will be saved under Integrated Reports (Reports--> Integrated Reports)
Q. How to mail a report?
- Open OpManager and click on Reports tab.
- Choose the report category.
- Click on the report that you want to email.
- Click on More Actions and choose Email this Report.
- Enter the details and click on Send.
- The report will be sucessfully mailed to the destination mail id.
- Notifications
Q. How to add custom fields to the Notification Profile message and subject?
- Go to Settings -> Notifications -> Add Profile and choose the type of Notification Profile you want (this does not apply for 'Web Alarm' and 'Invoke a Webhook').
- In the 'Subject Variable', 'Alarm Variable', 'Variable' and/or 'Message Variable' drop down choose an option under 'CustomFields for Devices' and enter other details.
- Click next and follow the instructions given here: https://www.manageengine.com/network-monitoring/help/configuring-notifications.html
To configure CustomFields for a device:
- Go to Inventory -> Devices -> Click on the devices.
- In the Device snapshot page, click on the edit option in the 'Custom Fields' header.
- Configure Custom Field details for the device and click 'Save'
Q. How to configure Notification Profiles specific to business hours?
- Go to Settings -> Notifications -> Add Profile and choose the type of Notification Profile you want.
- Enter the required details desired for the Notification Profile and click 'Next'.
- Select the necessary criteria, severity and click 'Next'.
- Select the devices for which you want this Notification Profile to be applied from the list of Available devices and click 'Next'.
- Select 'Apply this profile during specific time window' under 'Time Window'.
- Enter the time window of your business hours, select the days and enter the other required details before clicking 'Next'.
- Click on the 'Save' button.
Now the Notification Profile is active only during your business hours as configured.
Q. How to configure Notification Profiles to send recurring triggers till the alarm is acknowledged?
- Go to Settings -> Notifications -> Add Profile and choose the type of Notification Profile you want.
- Enter the required details desired for the Notification Profile and click 'Next'.
- Select the necessary criteria, severity and click 'Next'.
- Select the devices for which you want this Notification Profile to be applied from the list of Available devices and click 'Next'.
- Under 'Recurring Trigger' enter the 'Trigger Interval', select the 'Do not trigger if alarm is Acknowledged' option.
- Enter the other required details before clicking 'Next'.
- Click on the 'Save' button.
Q. How to associate Notification Profiles to Datastores?
To associate Notification Profiles to Datastores:
- Go to Settings -> Notifications -> Add Profile and choose the type of Notification Profile you want to associate.
- Enter the required details desired for the Notification Profile and click 'Next'.
- Select the necessary criteria, severity and click 'Next'.
- Now, Filter by 'VMware-Datastores' Select the Datastores for which you want this Notification Profile to be applied and click 'Next'.
- Enter the other required details before clicking 'Next'.
- Click on the 'Save' button.
Now the Notification Profile is associated to the Datastores selected.
- Root cause analysis
- How to create a new RCA Profile?
- How to create a RCA Profile with alarm data?
- How to create RCA for a group?
- How to reopen a RCA Profile that is marked as resolved?
- How to visualize the monitors as graphs in RCA?
- How to add annotation notes in RCA?
- How to display all monitors associated with the selected entities?
Q.How to create a new RCA Profile?
- Navigate to Alarms -- Root cause analysis.
- Click on Create RCA Profile.
- Select the module: Devices, URLs, Groups (Create an interface group to display interfaces)
- Choose the module, you can find the entities listed under Available Entities.
- Check the box to move an entity from the Available Entities window to the Selected Entities window.
- Click on Next to create a RCA Profile.
Q.How to create a RCA Profile with alarm data?
- Click on the Alarms tab.
- Click on an alarm to open the alarm snapshot page.
- Click on the Root Cause Analysis tab.
- Click on the Yes button that is available next to the question.
- It will take you to the RCA Profile page, where you can see the list of entities (devices, URLs or interfaces) associated with that alarm.
Q.How to create RCA for a group?
- Navigate to Settings --> Configuration --> Groups.
- Click on the graph symbol available under the Actions tab.
- It will take you to the RCA Profile page, where you can see the list of entities associated with the group.
- You can select the required entities and perform RCA.
- Navigate to Alarms -- Root cause analysis.
- Click on the edit icon against the RCA Profile that you want to open.
- Click on the Resolved status button at the top to switch to Reopen.
Q.How to visualize the monitors as graphs in RCA?
- After you have selected the entities, you can see the monitors associated with the entities on the left pane.
- Simple drag and drop the required monitors in the window (at the center) to visualize them graphically.
Q.How to add annotation notes in RCA?
- Hover your cursor at a point on the graph.
- Click on Add annotation.
- Record your notes.
- Click save.
Q.How to display all monitors associated with the selected entities?
- Click on the filter icon at the top.
- Choose show all monitors to list down all the monitors associated with the selected entities. (By default, only threshold-enabled and availability monitors are listed.)