Schedule demo


What's New in Applications Manager

New feature alert

Amazon DynamoDB Monitor

Applications Manager now provides round the clock monitoring for Amazon Dynamo DB, a fully managed NoSQL database offered by Amazon AWS. You can now track key metrics like read and write capacity units,alatency, throttled requests, secondary indexes, streams and much more.
Know More

Overcome application performance monitoring barriers

Get end-to-end visibility into your applications with
Applications Manager free training series.
11:00 AM EDT | 6:00 AM GMT
Aug 21, 28, Sept 4 & 11, 2019

Register Now

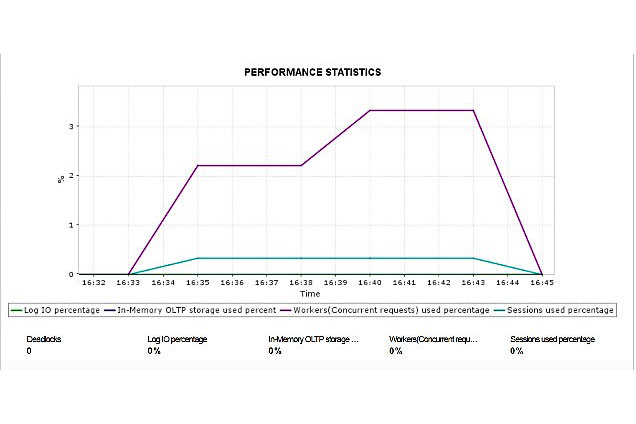
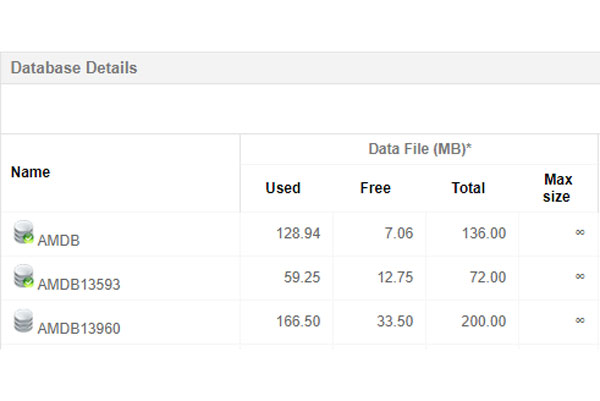
Now supports Azure SQL Database

Ensure optimal performance of your Azure SQL Database servers. Track key performance indicators, troubleshoot deadlocks, monitor active sessions and much more.

Learn More

New metrics. Enhanced support for SQL.

You can now track key metrics of your Microsoft SQL monitor like SQL database connection details, configuration details, database actions, job history reports, replication agent history, server database mirroring, clusters, etc.

Learn More

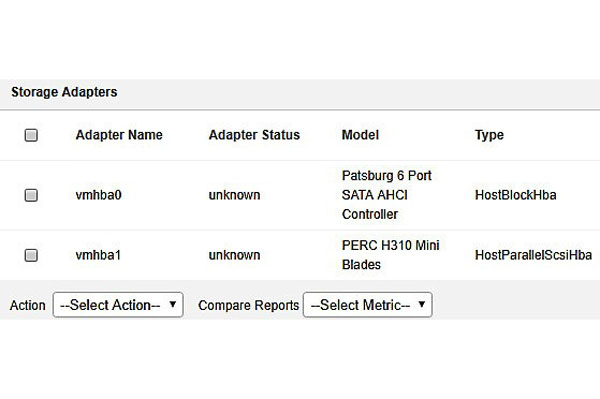
VMware monitoring enhanced

Access different storage devices, display the available storage adapters and review their information with VMware Storage Adapters. Learn More

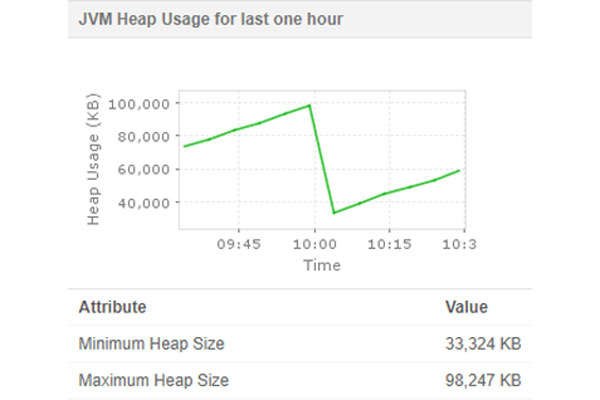
WebLogic. Turned up to 12.x

Extended support up to version 12.x to enhance monitoring experience of your WebLogic servers. Experience increased application availability, proactive alerts and much more(available from build 13800 onwards).

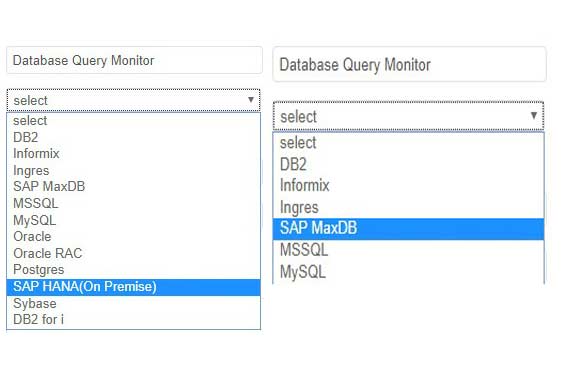
Database query monitor gets a boost

Applications Manager now supports monitoring of SAP HANA (on premise) and SAP MaxDB database queries in Database Query Monitor(available from build 13860 onwards).

Forecast reports get a boost with Machine learning techniques

Applications Manager has roped in machine learning techniques to give a boost to your forecast reports.This feature will help users make accurate estimates of growth trend of attributes like disk utilization of servers, database size, etc.so that they can plan capacity better.You can view the forecast by growth trend upto 3 years(available from build 13860 onwards). Learn More

SSH connectivity amplified

SSH connectivity has been enhanced using Key Exchange (KEX) method with support for diffie-helamn-group14-sha256, diffie-helman-group 15-sha512,diffie-helman-group 16-sha512, diffie-helman-group 17-sha512, and diffie-helman-group 17-sha512 algorithms. You can now select the preferred KEX algorithm that is to be used while establishing connection via SSH.

Plan what you need. Exactly when you need it.

Avail capacity planning under scheduled reports.You can now receive the undersized and over sized server details by configuring a schedule reports of capacity planning type(available from build 13840 onwards).

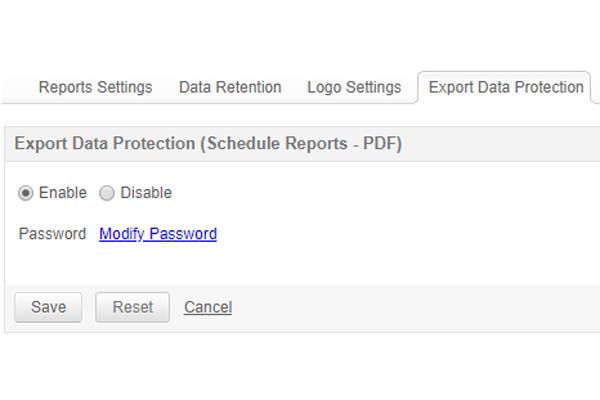
Protection. Privacy. Access.

Password protection has been added for reports that are exported in pdf format.

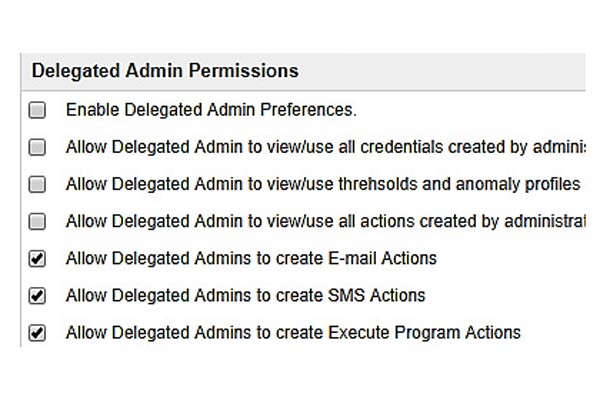
More power to delegated admins!

Admins can now grant permission to delegated admins for creating actions.

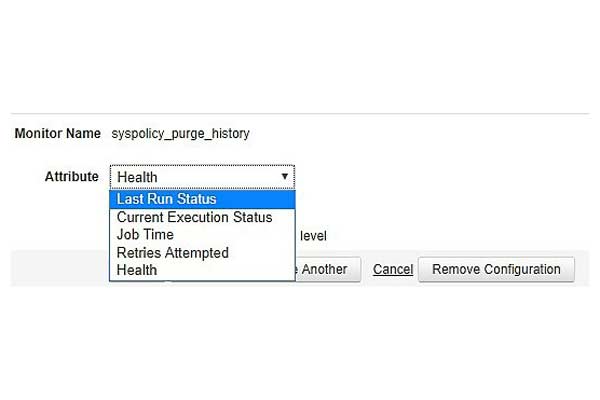
Generate customized alarms

You can now customize alarms in MS SQL for last run status and current execution status of jobs.

Enable and disable with a click

You can now enable/disable the "Probe server down" email alerts from the Central server directly via UI and Rest API (available from build 13830 onwards).

Capacity planning made easy.

With our new feature, you can now view server disk utilization details of a particular monitor for a specific time interval configured by the user

Proxy settings for EUM enhanced.

Applications Manager now supports Automatic proxy configuration URL for End-User Monitoring. EUM agent uses the proxy settings defined in the PAC file.

New in schedule reports

On scheduling a report with threshold action profile CSV as report type, you can receive mail with in-detail report. Threshold and action profile CSV report feature has been added under schedule reports (available from build 13820 onwards).

You'll be in great company

Loved by customers all over the world

"Standout Tool With Extensive Monitoring Capabilities"

It allows us to track crucial metrics such as response times, resource utilization, error rates, and transaction performance. The real-time monitoring alerts promptly notify us of any issues or anomalies, enabling us to take immediate action.

Reviewer Role: Research and Development

"I like Applications Manager because it helps us to detect issues present in our servers and SQL databases."
Carlos Rivero

Tech Support Manager, Lexmark

Trusted by over 6000+ businesses globally