Comprehensive Apache monitoring
Apache monitoring with Applications Manager
Gain real-time insights for Apache servers and resolve issues instantly
Applications Manager's tool for Apache monitoring lets you gain insights into real-time performance metrics, identifies issues, and paves way for smooth user experiences of your web server. Its advanced Apache server monitoring capabilities automatically tracks worker nodes, aggregates critical KPIs, identifies performance anomalies, and paves the way for proactive resolution of underlying infrastructure issues before they impact your business-critical web applications.
Applications Manager's Apache server monitor aggregates critical KPI data to help you identify performance issues and troubleshoot them faster. With Applications Manager's Apache server monitoring tool, you can:
- Monitor Apache response time
- Keep track of incoming requests
- Monitor worker resource metrics
- Become aware of connections in the server
- Keep an eye on system load
- Get notified of issues with proactive alerts
- Analyze server performance with comprehensive reports
Monitor Apache response time
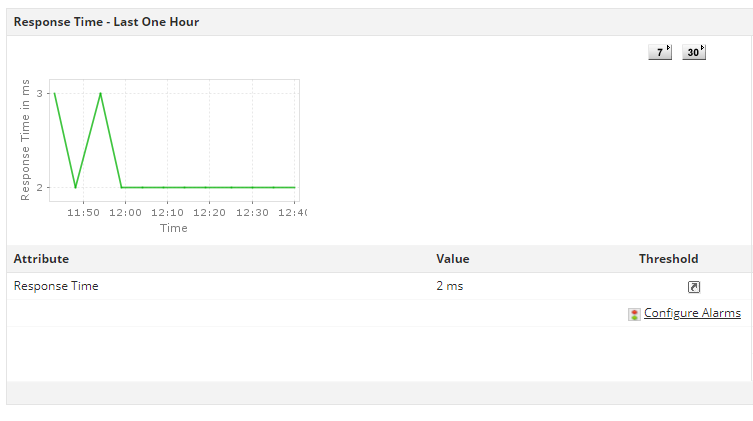
Apache response time monitoring plays a pivotal role in ensuring that your website or application consistently delivers optimal performance, keeping visitors engaged and satisfied. By closely tracking and analyzing the response time of your Apache server with a dedicated Apache monitoring tool for web server performance, you can proactively identify potential issues and take timely measures to optimize your website's performance. The Apache monitor enables you to monitor response times of Apache servers and troubleshoot underlying issues before it impacts the operation of business-critical applications hosted on them.
Keep track of incoming requests
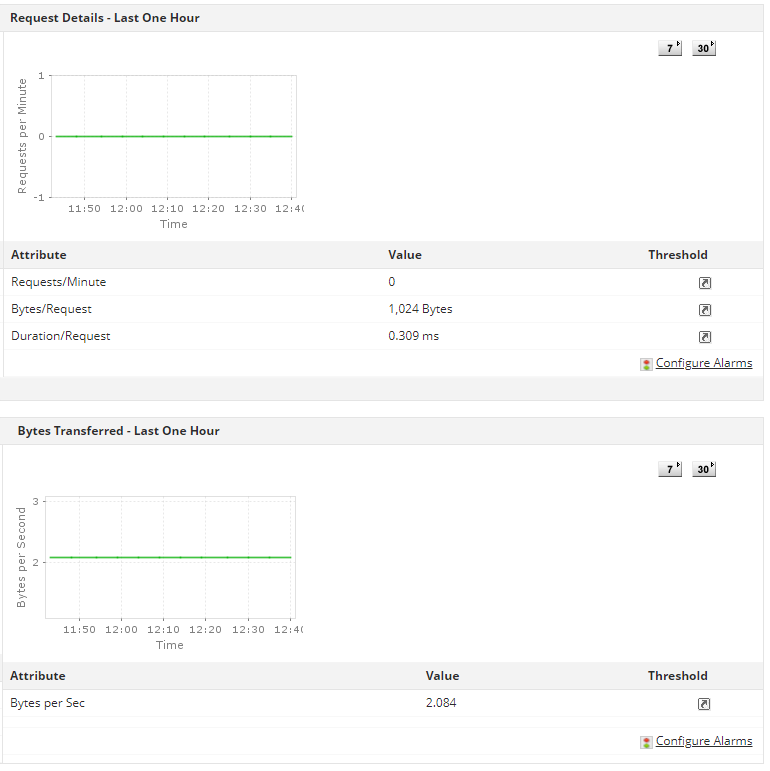
Tracking and analyzing incoming requests and traffic patterns allows you to gain valuable insights that enable you to make informed decisions, optimize server resources, and enhance the user experience. With Applications Manager's Apache web server monitoring, get real-time insights about incoming requests. Our Apache monitoring dashboard allows you to configure alarms and get alerts when the number of requests increase beyond a set threshold to prevent your server from overloading. You can also monitor Apache Server ExtendedStatus metrics such as Bytes/Request and Bytes per Sec that can help you discover deeper server performance problems.
Monitor worker resource metrics
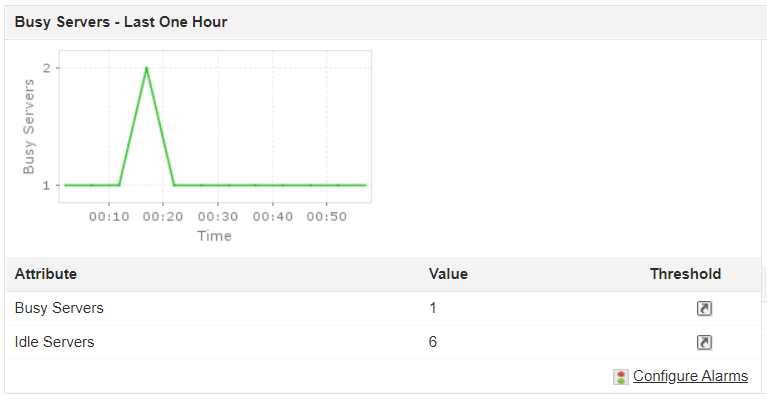
Monitoring worker resource metrics helps administrators understand how the server resources are utilized by different applications and processes. With our Apache monitor, get visibility into worker resource metrics to see if your resources are being over- or underutilized. Apache web server performance monitoring achieves this by keeping track of the number of busy and idle workers. A low value of Idle Workers may indicate a slow request processing pattern and might interfere with server performance.
Become aware of connections in the server
Connections in an Apache server represent the fundamental links through which client devices communicate with the server to request and receive web content. With Applications Manager's Apache web server monitor, learn extensively about the connections in the server. Monitor the total number of connections and asynchronous connections. You can also individually track the number of Writing, Keep-alive and Closing asynchronous connections.

Keep an eye on system load
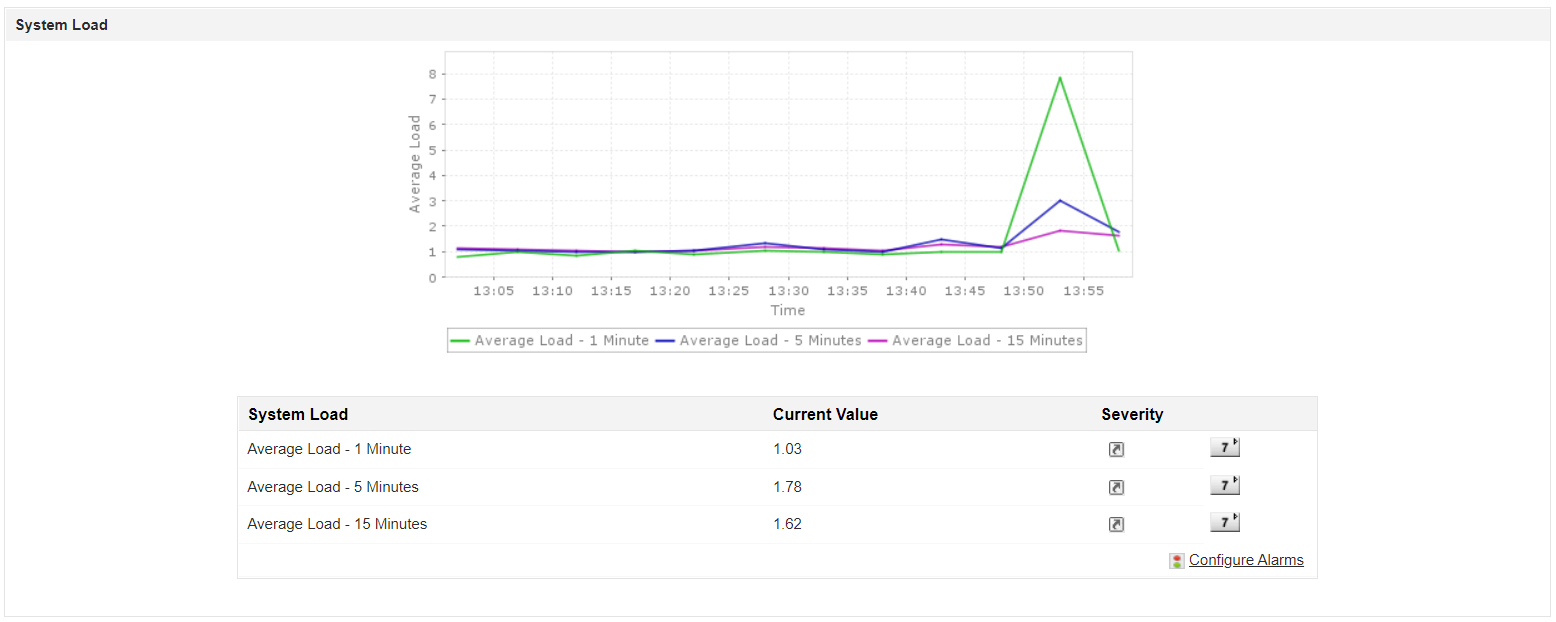
Monitoring system load is essential for administrators to maintain server stability and gauge real-time workload. Using an apache server monitor, you can gain a comprehensive overview of server uptime and performance. Our Apache monitor allows you to track the CPU load of Apache workers 24/7 to prevent critical system overloads. Track the amount of load the Apache workers weigh in on the CPU by monitoring the number of processes in the server round the clock and prevent CPU overload. A high CPU load might cause the server to shut down, so it is pivotal to configure alarms for this metric to avoid sudden server outages. You can also compare and study the average system load of the server in the one, five, and fifteen minute marks.
Get notified of issues with proactive alerts
With Applications Manager's real time Apache monitoring tool:
- Configure alarms for different performance attributes of your web server to receive notifications of threshold violations in the channel of your choice: e-mail and SMS.
- Set up dynamic baselines to proactively detect anomalies.
- Enable automated actions for self healing and reduce MTTR.

Analyze server performance with comprehensive reports
Leverage Applications Manager's Apache performance monitoring capability to:
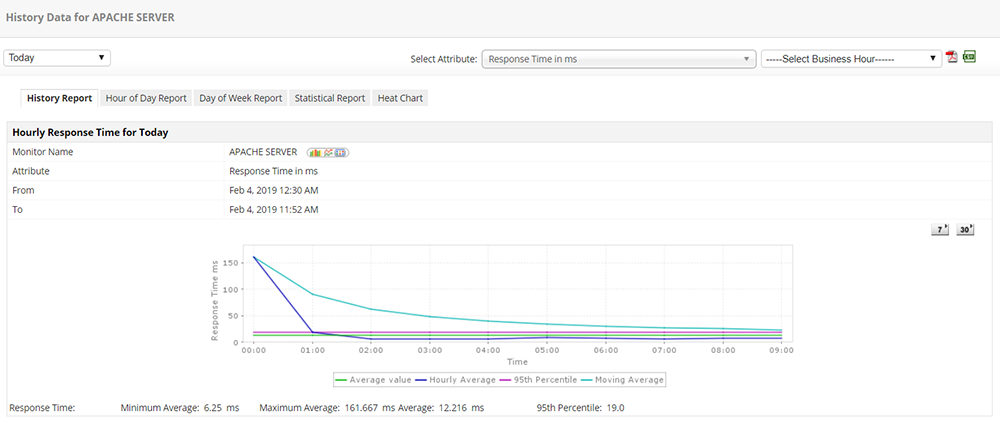
- View and analyze Apache server performance with historical trends of critical Apache web server metrics.
- Leverage machine learning techniques to forecast growth and utilization trends of your servers in the future.
- Plan your resources and capacity to ensure effective load distribution in your Apache web servers.
Supported web servers:
In addition to Apache server monitoring, Applications Manager also offers monitoring for the following web servers/services:
Go beyond monitoring Apache with plain native Apache monitoring tools
Although Apache offers the mod_status module with decent information about what Apache is doing at any given time, it is often not enough to know if the requests are returning correct information. Apache performance monitoring tools like Applications Manager enable you to holistically monitor Apache server performance through Apache server monitoring by providing extra viewpoints such as operating system and server usage, synthetic transaction monitoring and real user monitoring.
Simplify Apache monitoring with Applications Manager
FAQs about Apache monitoring
What is an Apache monitor?
+
How to monitor an Apache web server?
+
Why is monitoring Apache worker resources important?
+

