Windows Performance Counter Monitoring
Monitor the performance of your systems with ease
Use Applications manager's Windows WMI monitoring mode to monitor important Windows performance counters. Get real time information about the performance of your system and identify bottlenecks or issues instantly.

Note: Windows Performance Counters is currently supported for Windows server 2000, 2003, 2008, 2008 R2, 2012, 2016, 2019, 2022, Windows Vista, XP, NT, 7, 8, 10.
Track specific Windows Classes
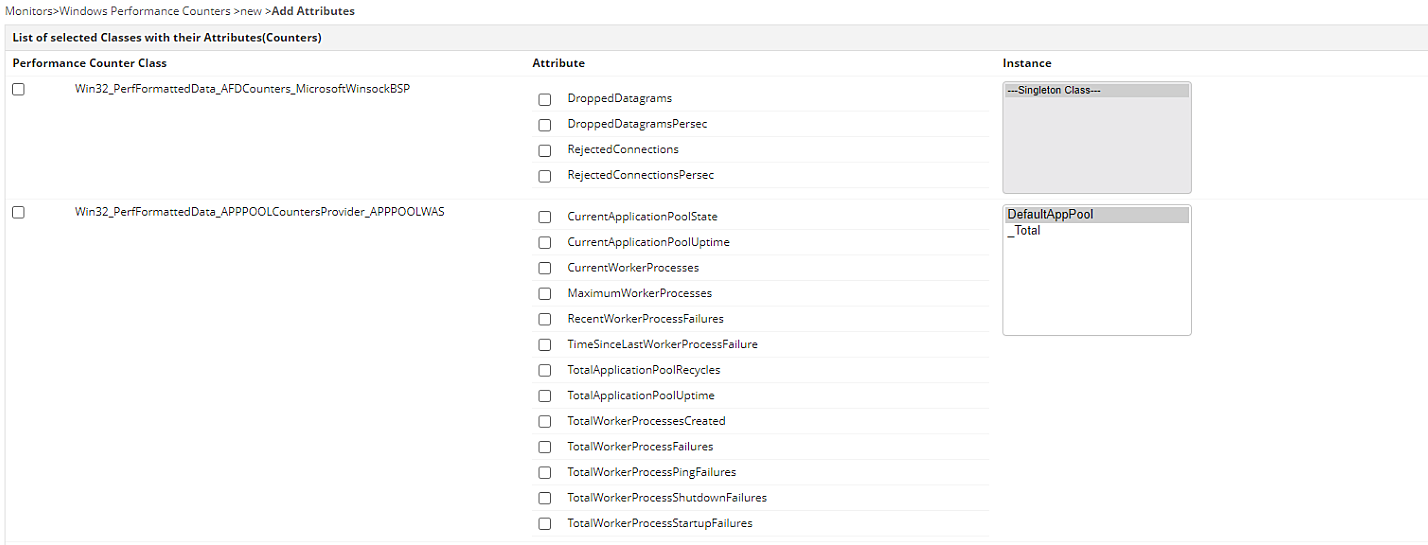
In the Windows Performance Counters, counters are grouped into classes, which represent different types of system performance information. With Applications Manager, add and monitor different counter classes and their corresponding metrics.
To monitor the performance of the CPU, you can add the Processor counter class and track metrics such as % Processor Time, Interrupts/sec, and Processor Queue Length. Similarly, you can add the Memory counter class to measure Available Mbytes, Pages/sec, and Page Faults/sec.

Note: The specific counters and classes available will depend on the version of Windows and the specific hardware configuration of the system you want to monitor.
Monitor counter class instances
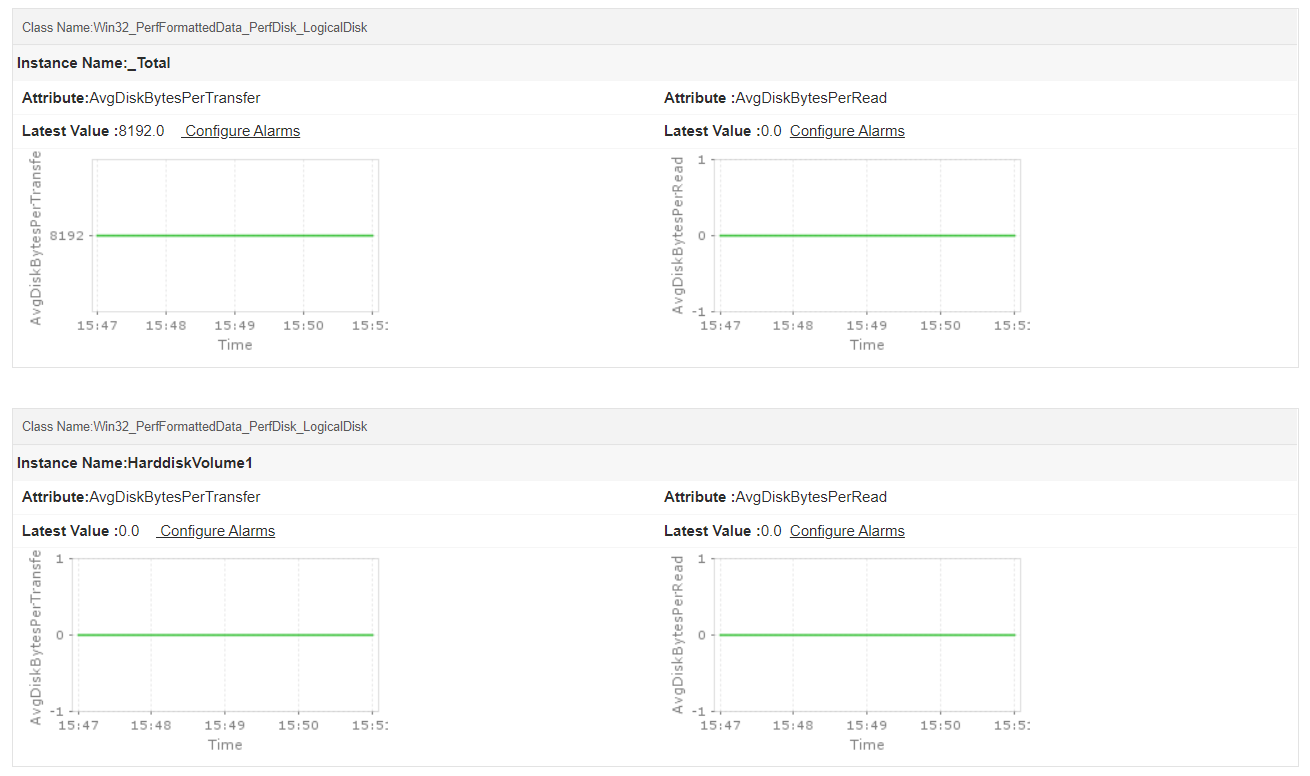
In Windows Performance Counters, instances are specific instances of a performance counter class. For example, if you are monitoring the Physical Disk class, the instances will be the individual disk drives in the system. If you are monitoring the Processor class, the instances will be the individual processors or cores in the system.
With Applications Manager, you can choose to monitor instances of a performance counter class separately. This allows you to monitor performance data for specific devices or components, rather than just for the overall system.
For example, you can monitor the % Disk Time counter for each disk drive in the system to identify which drives are the busiest. Similarly, you can monitor the % Processor Time counter for each processor or core in the system to isolate the over-utilized processors.

AI-powered smart alerts and reports
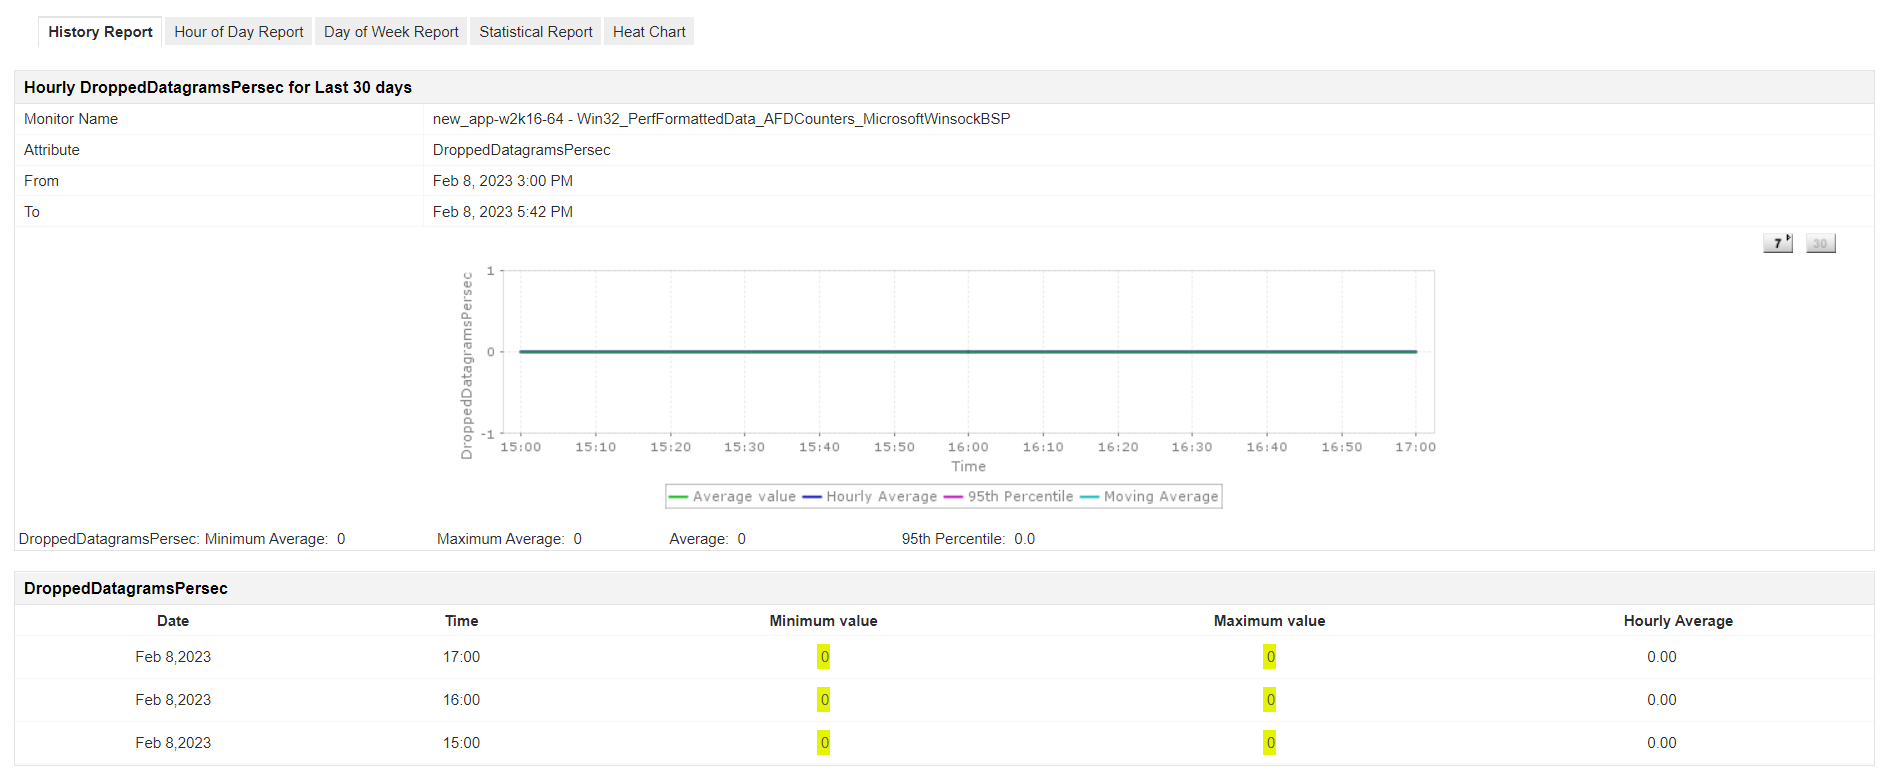
Configure alerts on important performance counters and get notified through different mediums - Email, SMS, Slack, etc. Analyze trend reports to understand system performance and plan capacity. You can even save and download the reports in both html and PDF formats.

Get started in just a few minutes!
If you're looking for a proactive Windows performance counters monitoring tool to optimize system performance, try Applications Manager. Download a free, 30-day trial now!

