WildFly Monitoring made simple
Applications Manager's WildFly monitoring feature helps you gain deep insight into the performance of your WildFly application servers and applications that run on them. Troubleshoot performance bottlenecks before they affect your end users and ensure optimal performance of your WildFly environment.
Get unmatched visibility into WildFly monitoring
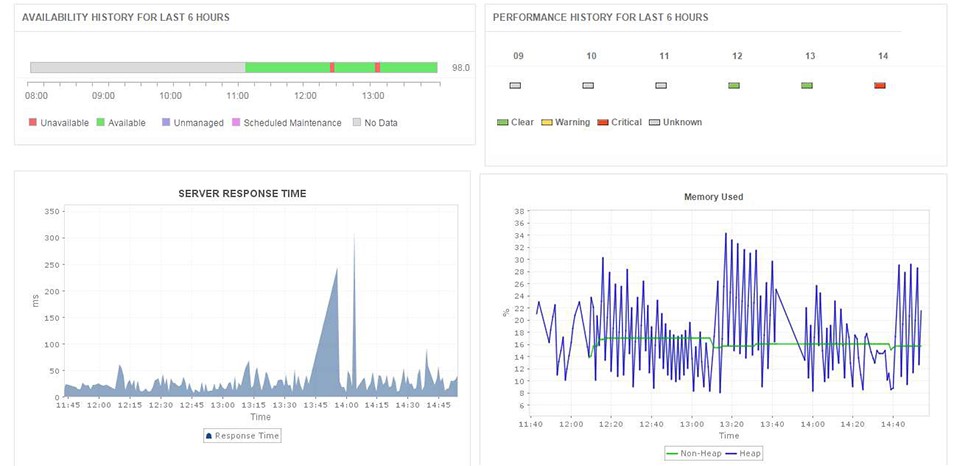
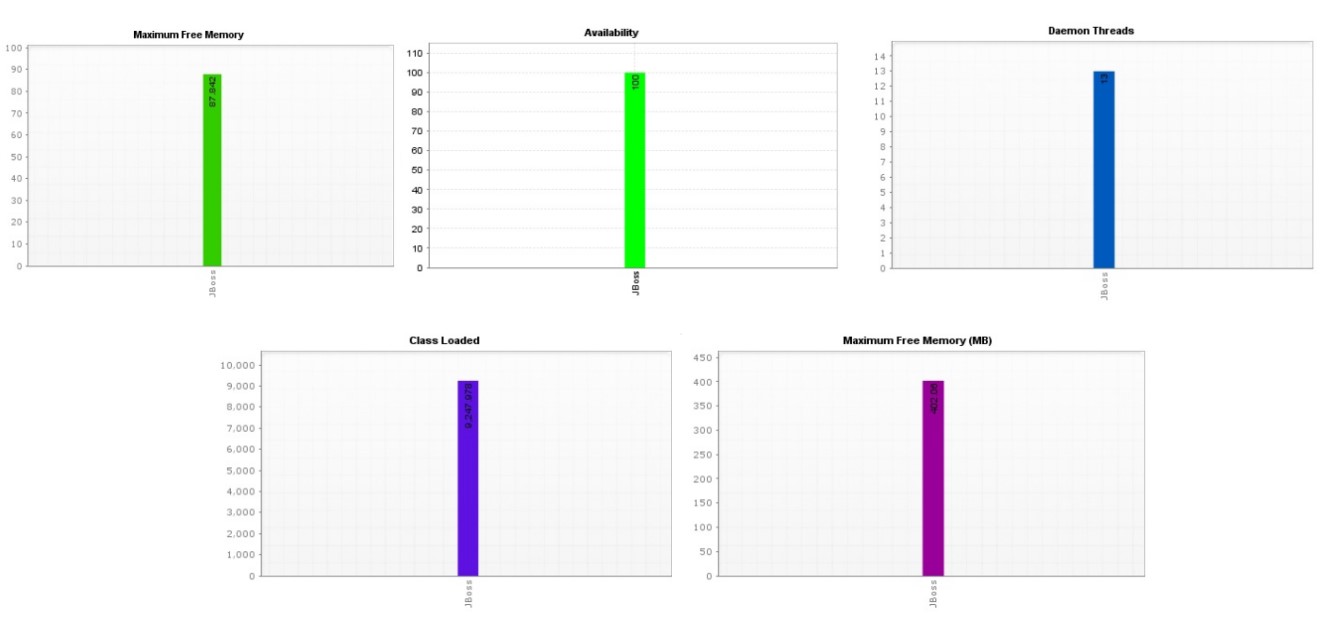
Monitor critical WildFly metrics like service response time, performance of web applications deployed on WildfFly as well as components such as Java virtual machine (JVM), Enterprise Java Beans(EJBs), Java database connection pools(JDBC) and servlets.

Achieve peak performance of WildFly Server
Avoid timeouts and reduce overhead to transaction processing through proper tuning of JDBC connection pool settings with the aid of Applications Manager's WildFly performance monitoring capability.

Automate tasks to increase efficiency
Restart the WildFly server without our WildFly monitor when the memory usage exceeds a threshold by executing custom scripts. This sort of automation reduces manual work for the IT operations personnel.
Identify problematic code for quicker troubleshooting
Monitor Java heap and non-heap memory and generate a heap dump to troubleshoot a problem. Get to know more about garbage collection patterns, throughput, deadlocked threads and other JVM parameters to tune Java performance.

Perform capacity planning for servers and databases
Our WildFly management system helps ensure key performance indicators of servers and databases like log file growth, CPU/disk usage of the database server are well within the permissible range. Identify resources based on their utilization and plan capacity accordingly. Avoid unpleasant surprises like your application servers suddenly running out of resources.
Track user experience of applications deployed on WildFly server
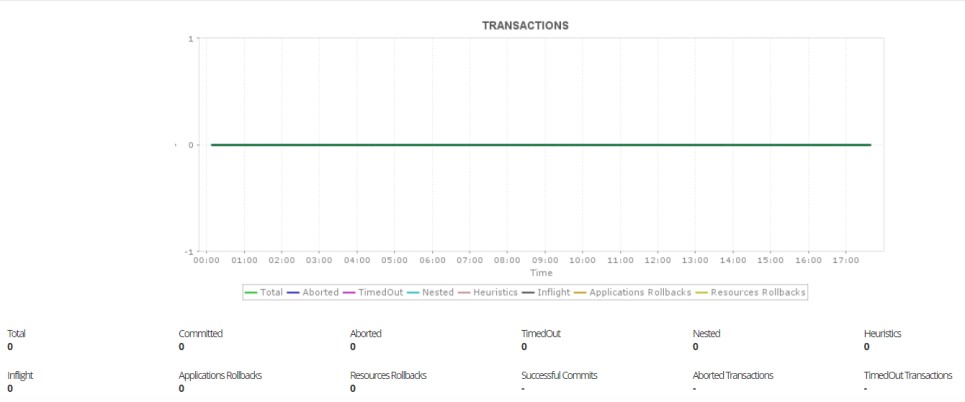
Applications Manager provides a hollistic view of Java transaction statistics such as number of successful commits, resource rollbacks, timeout count, and other relevant parameters that can help you accurately gauge its efficiency and quickly identify any performance bottlenecks if present.

Easily available and in-depth reports
Using WildFly monitoring tools like Applications Manager, you get out-of-the-box reports that help perform trend analysis, identify bottlenecks, and plan capacity for your Wildfly environment - all this without making any configuration changes.

Get started with WildFly monitoring in just a few minutes!
Experience WildFly monitoring on your own by downloading Applications Manager's full-fledged, 30-day free trial!

