HBase monitoring
HBase is a distributed, NoSQL database used by many businesses to process large amounts of data in real time. Applications Manager offers a comprehensive HBase monitoring feature that provides deep insight into the health and performance of your Apache HBase clusters and helps you perform quick troubleshooting of issues before users are affected.
Capabilities of HBase monitoring tool
Track Apache HBase cluster metrics
Monitor HBase clusters to make sure your HBase cluster is up and running and is continuously operating as expected. HBase performance monitoring helps track the average load, requests, and the number of dead, live and overall number of region servers.

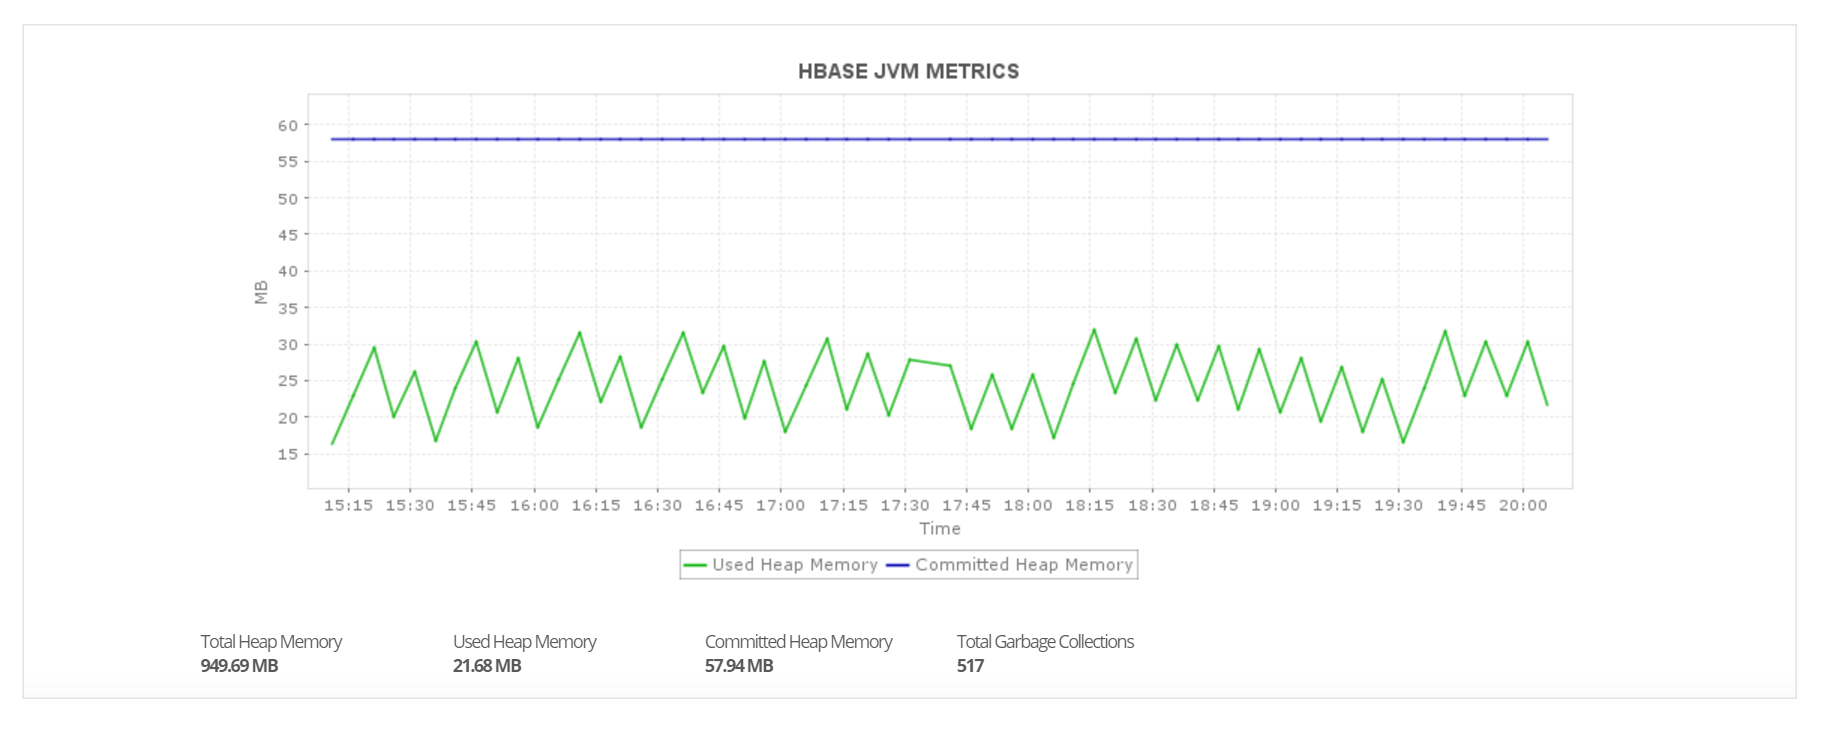
Keep tabs on memory and JVM usage
Track memory usage details such as available memory, free and total swap space size, the committed virtual memory size, etc. Keep track of JVM metrics to correlate server performance with underlying JVM internals. This information can be used when tuning your HBase cluster setup.

Understand how the region servers are performing
The region servers have a good number of performance metrics since they are part of the actual data read and write path. With Applications Manager's Apache HBase monitoring, get metrics about the block cache and know the number of blocks currently in the cache, the remaining heap for the cache, the number of blocks that had to be removed because of heap size constraints (Block cache eviction count), the cache hit and miss counts, as well as the hit ratio (IV), which is the number of cache hits in relation to the total number of requests to the cache.

Also, you can look at compaction metrics which comes in handy when the region server has to perform the housekeeping task of compacting the storage files. Major compactions will also cause a sharp rise as they queue up all storage files. With the aid of critical Apache HBase metrics, Applications Manager tells you the number of completed compactions and the total size of storage files that have been compacted.
Another useful metric to look at is the memstore size which is the total heap space occupied by all memstores for the server in megabytes. It is the sum of all memstores across all online regions. You can also understand which client operations (Gets, Puts, Deletes, etc.) took too long to run or produced too much output.
Fix performance problems faster
Get instant notifications when there are performance issues with the components of Apache HBase components. Become aware of performance bottlenecks quickly and find out which application is causing the excessive load. Monitoring HBase using Applications Manager allows you to take corrective actions faster before users are affected.
Get started with Hbase monitoring in just a few minutes!
Experience Apache Hbase performance monitoring on your own by downloading Applications Manager's full-fledged, 30-day free trial!

