Linux Performance Monitoring
Linux server performance monitoring, when done efficiently, adds great value to the productivity of the organization. However, monitoring and debugging Linux performance problems is a tough job for sysadmins. Proactive Linux performance monitoring tools such as Applications Manager can help monitor Linux performance and pinpoint the root cause of issues by giving complete visibility into all the processes running in the system.
Key Linux performance monitoring metrics to watch out for:
Inspite of being a highly flexible, customizable, and scalable platform, there are several issues encountered by IT admins while monitoring Linux. Our optimal Linux server performance monitoring tool will help you keep an eye on important attributes such as the Thread count, Process count, Major page faults, Context Switches, current Server Time, and the Server Uptime, which shows you how long the server has been up and running. Other key metrics monitored by the tool include:
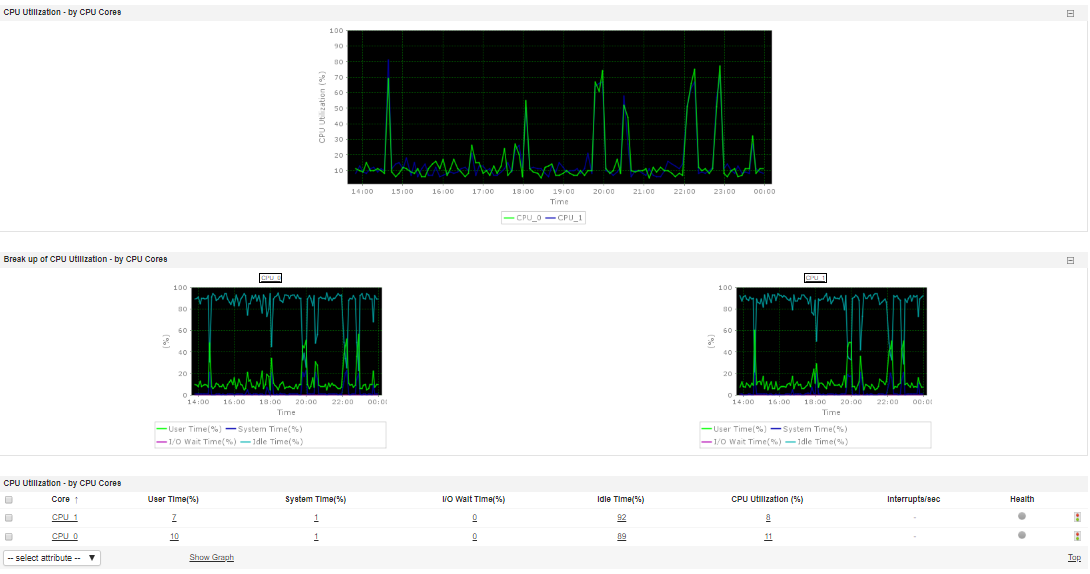
CPU Utilization
Applications Manager's Linux performance monitoring tool extensively shows CPU utilization with the break up of individual core utilization and their status. Keep an eye on critical attributes such as run queue, blocked processes, user time (%), system time (%), I/O wait time (%), Idle time (%), and Interrupts/sec. Allocate and manage CPU resources to avoid performance bottlenecks.
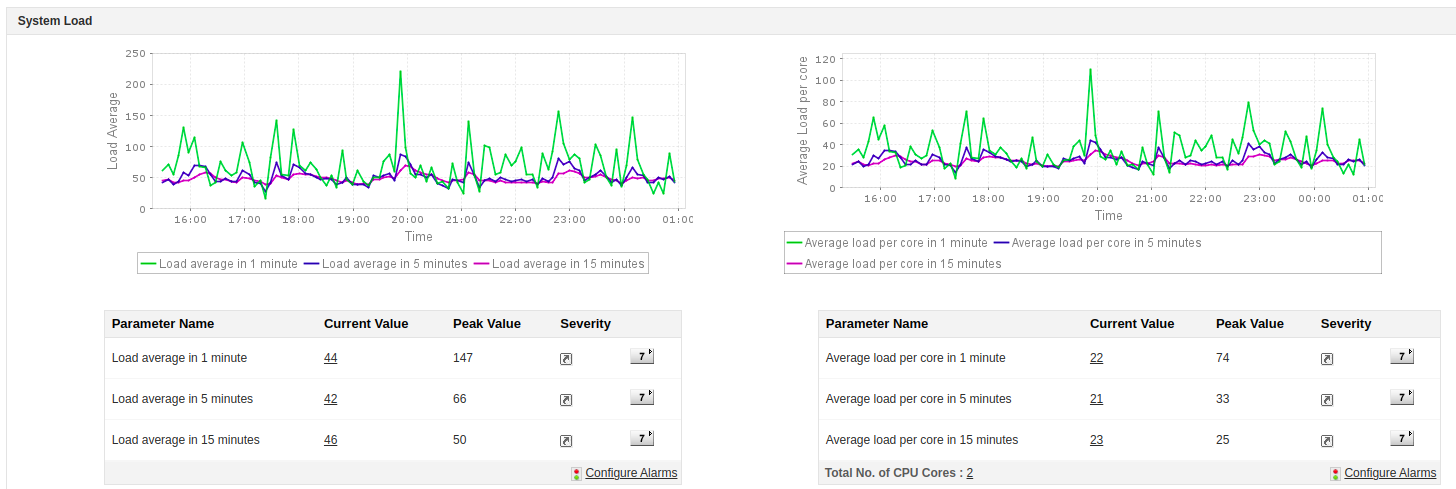
System load
System load gives a measure of computational work the system is performing. With our Linux application performance monitoring tool, keep track of the number of jobs executed, and the duration for which each process runs. Get alerts when the load average exceeds the set limit and identify the workload that needs to be moved.
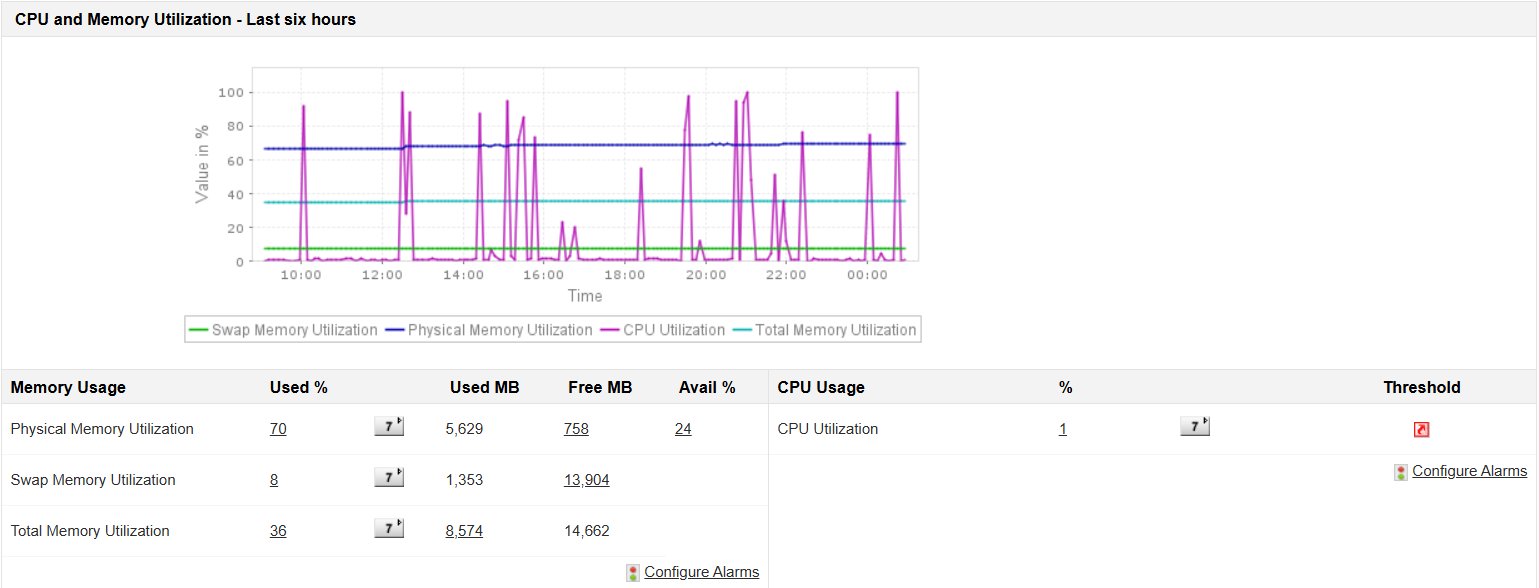
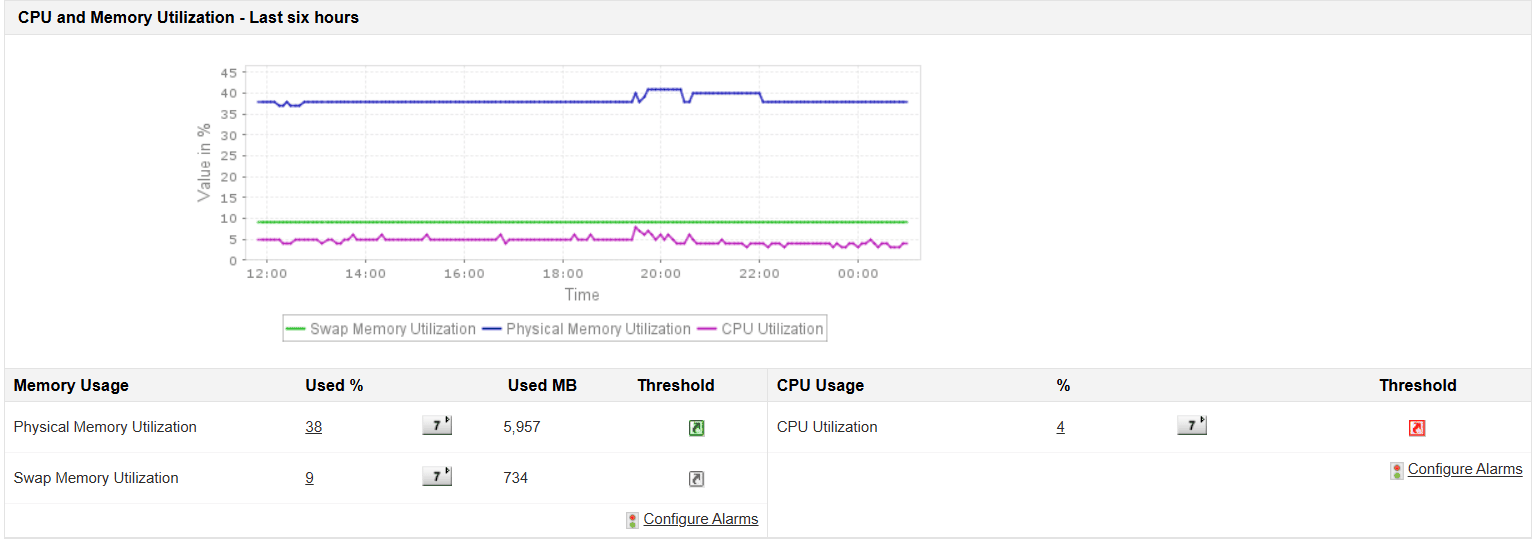
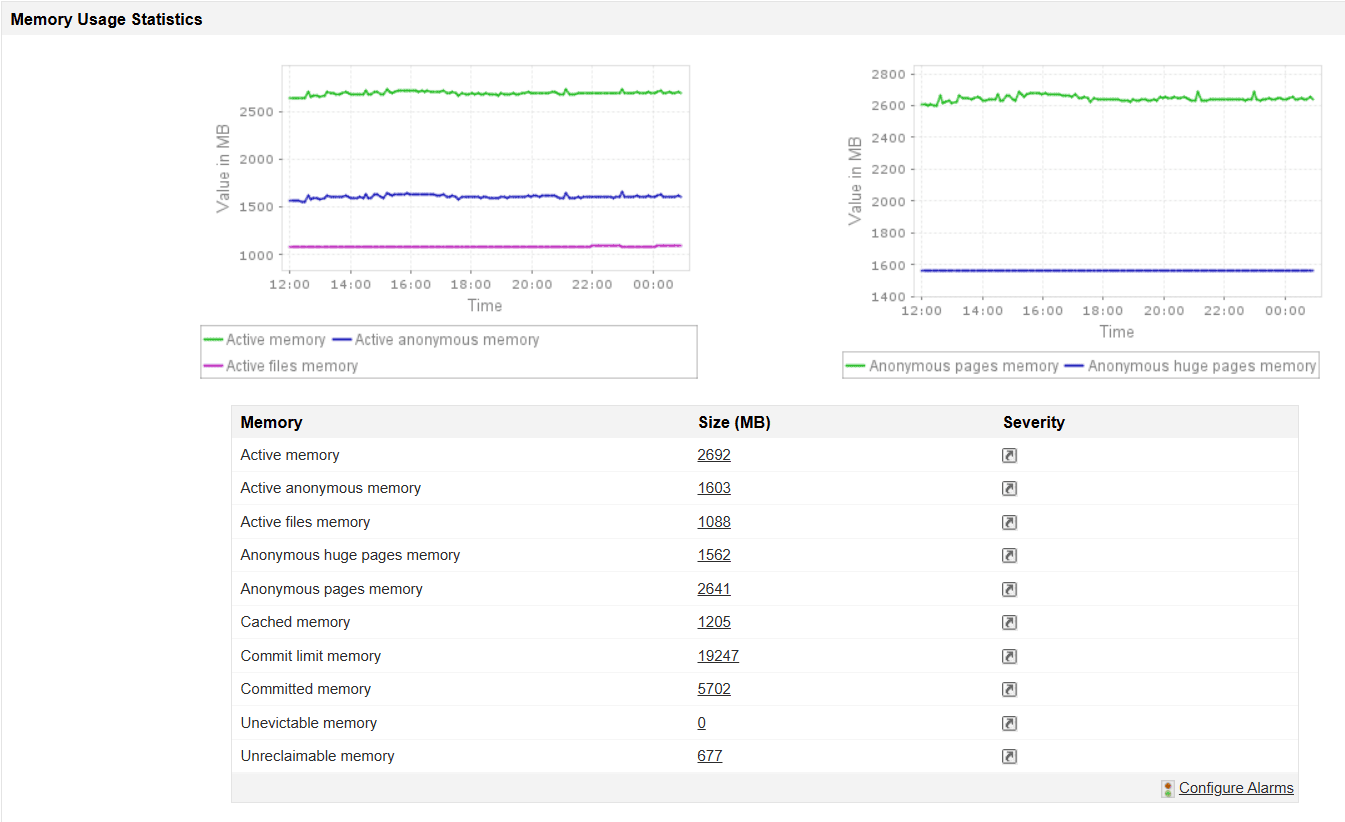
Memory Utilization and Process details
Trace memory usage to determine the load on the server. Gather details on the amount of swap and physical memory available. Insufficient memory impacts Linux server performance, causing it to run slow. With our Linux performance monitoring tool, determine the root cause of bottleneck in your system. Get in-depth information about critical parameters like thread count, process count, zombie process count, etc.
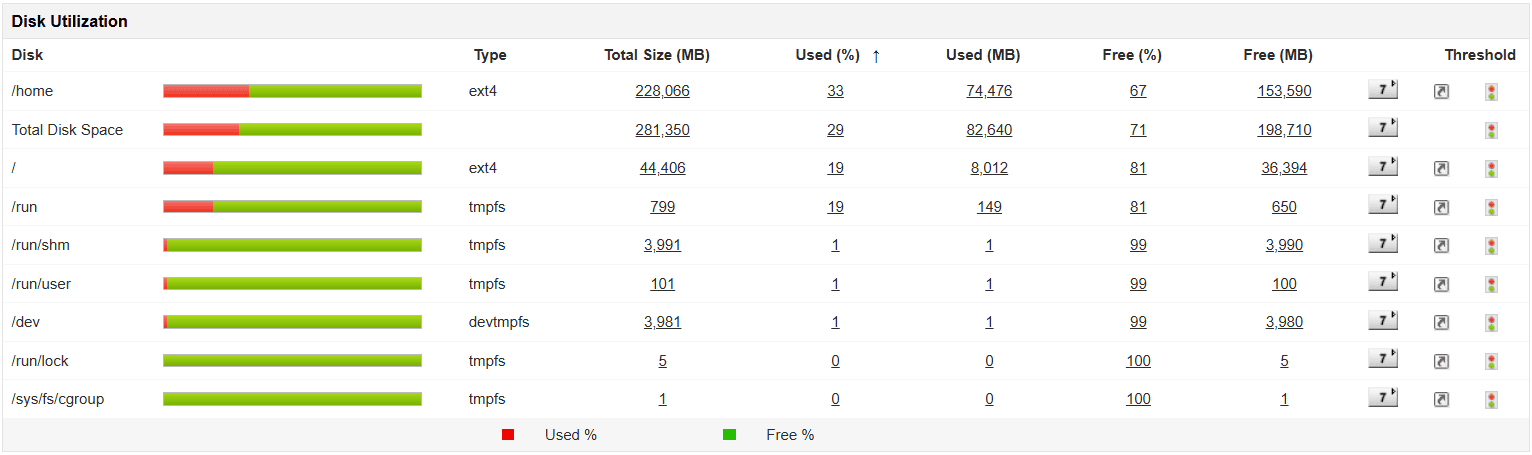
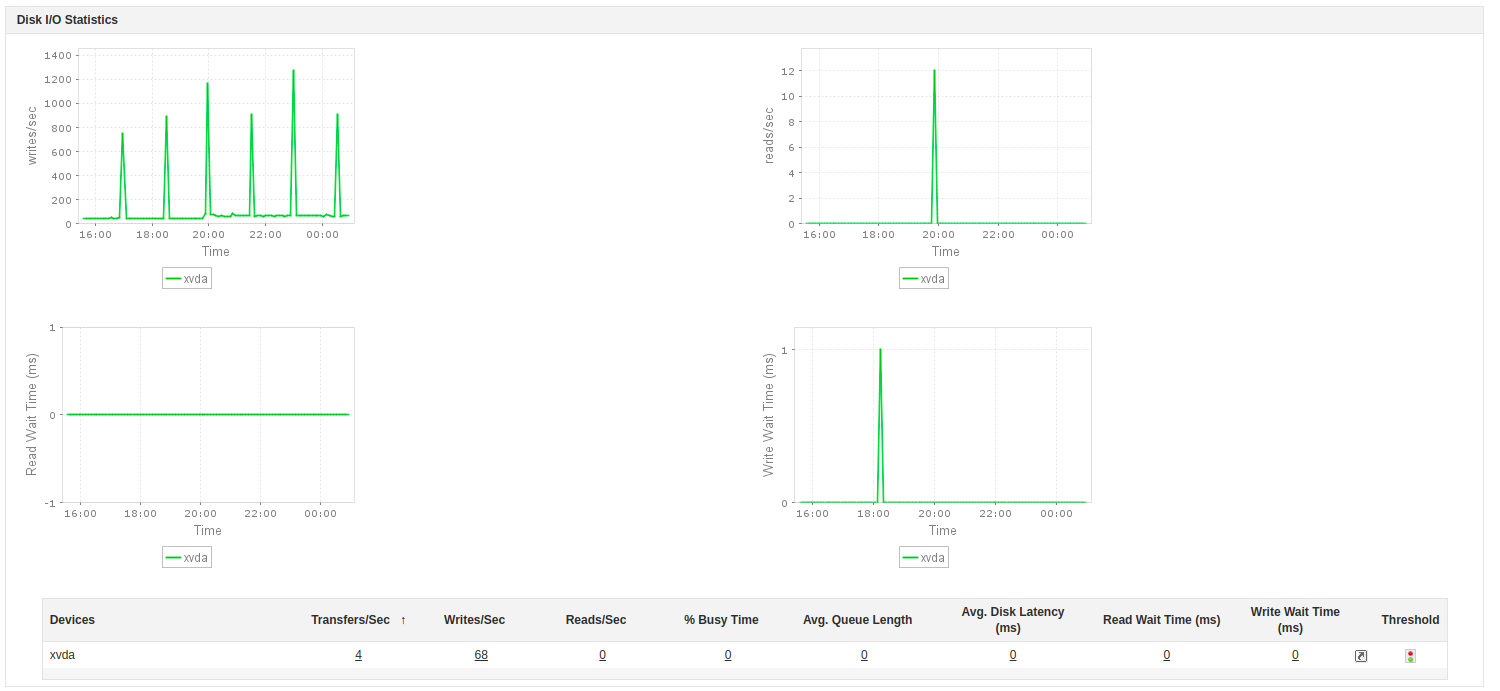
Disk Utilization
With our Linux performance monitoring software, track disk behavior to check for signs of hardware failure. Keep tabs on the amount of disk space used to ensure that adequate free space remains on the storage devices. Monitor disk usage and disk I/O to prevent application performance hiccups.
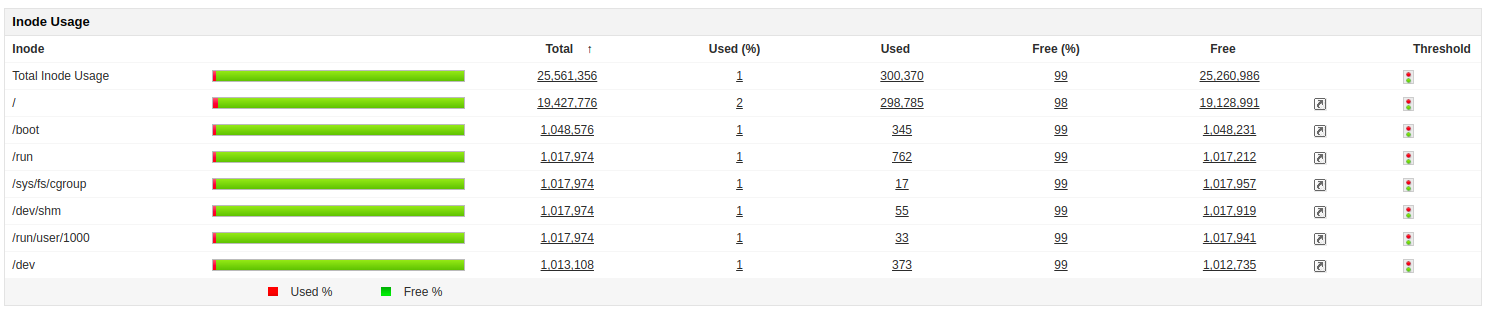
Inode usage
Linux systems use inode numbers, instead of file names, to identify files/directories while they are being created. Since every file must have an inode, the potential issue is that all the inodes of a disk might be completely used even before the disk is full. Our Linux performance management tool helps you track inode usage details, that reveal a lot about the number of nodes that have been consumed and the amount of space left. Keep tabs on inode limits per filesystem to improve Linux application performance.
Cron Jobs
Cron is a Linux metric that schedules commands or scripts to run on your server automatically at specific intervals. Cron jobs are used for running scheduled tasks like backups, emails, status checks, etc. and can be set to run by the minute, hour, day of the week/month based on the requirement.Cron jobs come handy if you want to automate repetitive tasks so it is critical to gain visibility into jobs that are executed at the back-end.
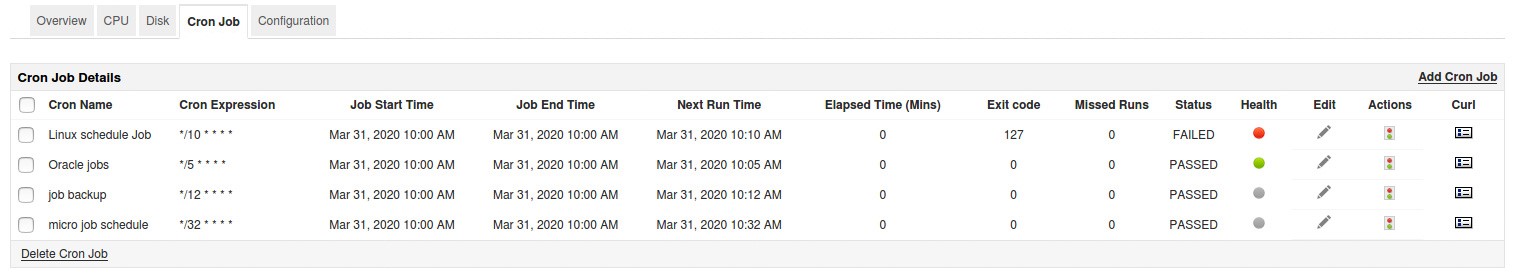
Applications Manager tracks three important cron job metrics that help ensure optimal Linux performance monitoring.
- Cron Job Script: Keep tabs on the script path that is executed in the cron job. Scripts that are executed as cron jobs are usually used to modify data on the server. You can also perform tasks that do not involve modifying data on the server, like sending out email notifications.
- Cron Job Command: Track the command that executes scripts on a recurring basis.
- Cron Job Action/Output: Get insight into the action or the output of the scripts. Scripts that are being called as cron jobs modify files or databases.
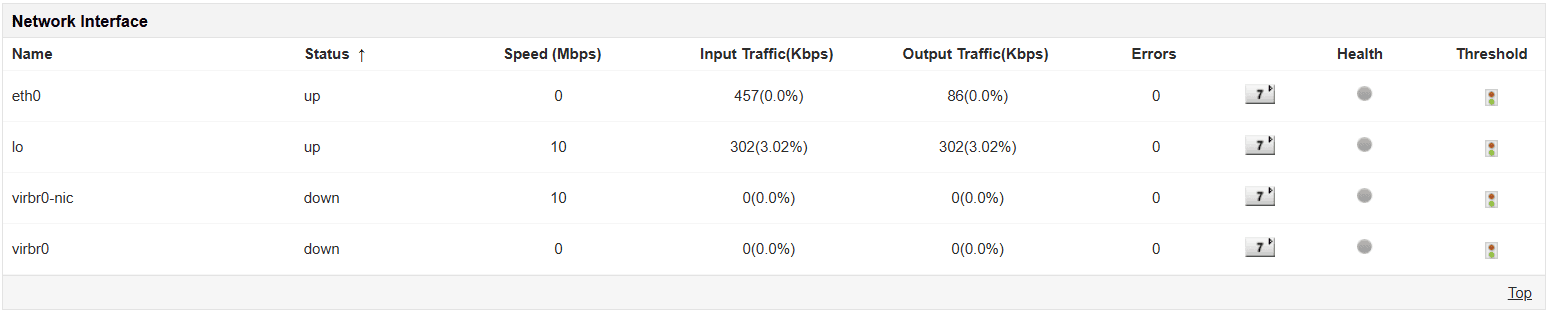
Network interfaces and Hardware metrics
Track and analyze network I/O statistics. Proactively monitor critical hardware metrics such as power supply rating, physical/logical drive failures, processor health, disk & array, memory, CPU, fan speed, temperature, voltage, etc. Our Linux application performance monitoring tool will help monitor and configure the health status of hardware servers.
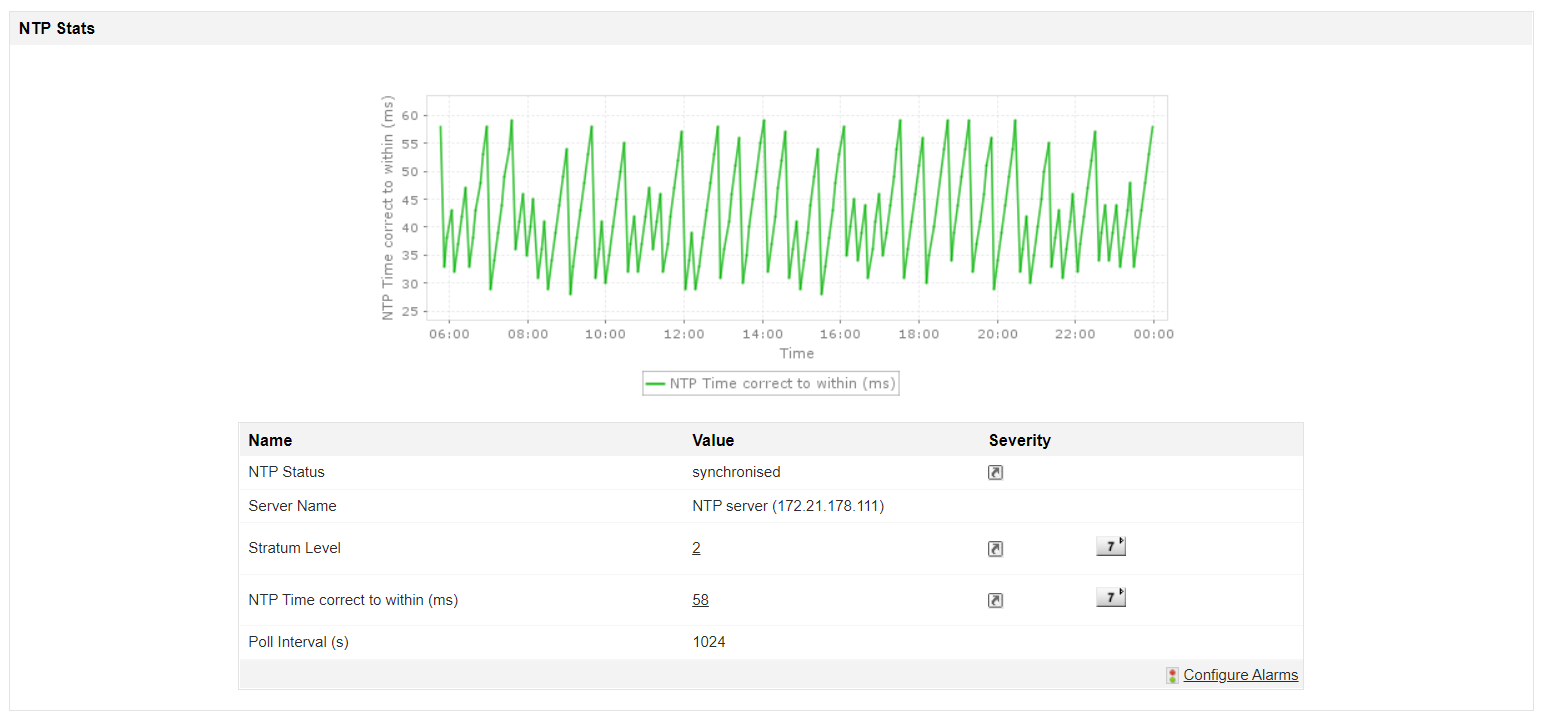
NTP Stats
Network Time Protocol (NTP) is usually used to synchronize system clocks among a set of distributed time servers and clients. With Applications Manager's linux performance monitor, get details about NTP Status. Quickly identify if the client is synchronized with the server at a glance. You can also get to know other metrics such as Server Name, Stratum level, NTP Time correct to within, and Poll Interval.
Get started with our Linux performance monitor!
Our Linux monitoring tool will help you ensure optimal performance of your Linux distributions including Red Hat Linux, Redhat Enterprise Linux, Mandriva, Fedora, SuSe, Debian, Ubuntu, CentOS, etc.
Apart from Linux monitoring, Applications Manager also offers proactive application performance monitoring for a wide range of other on-premise and cloud applications. You can download a 30-day free trial and start monitoring in just a few minutes!
