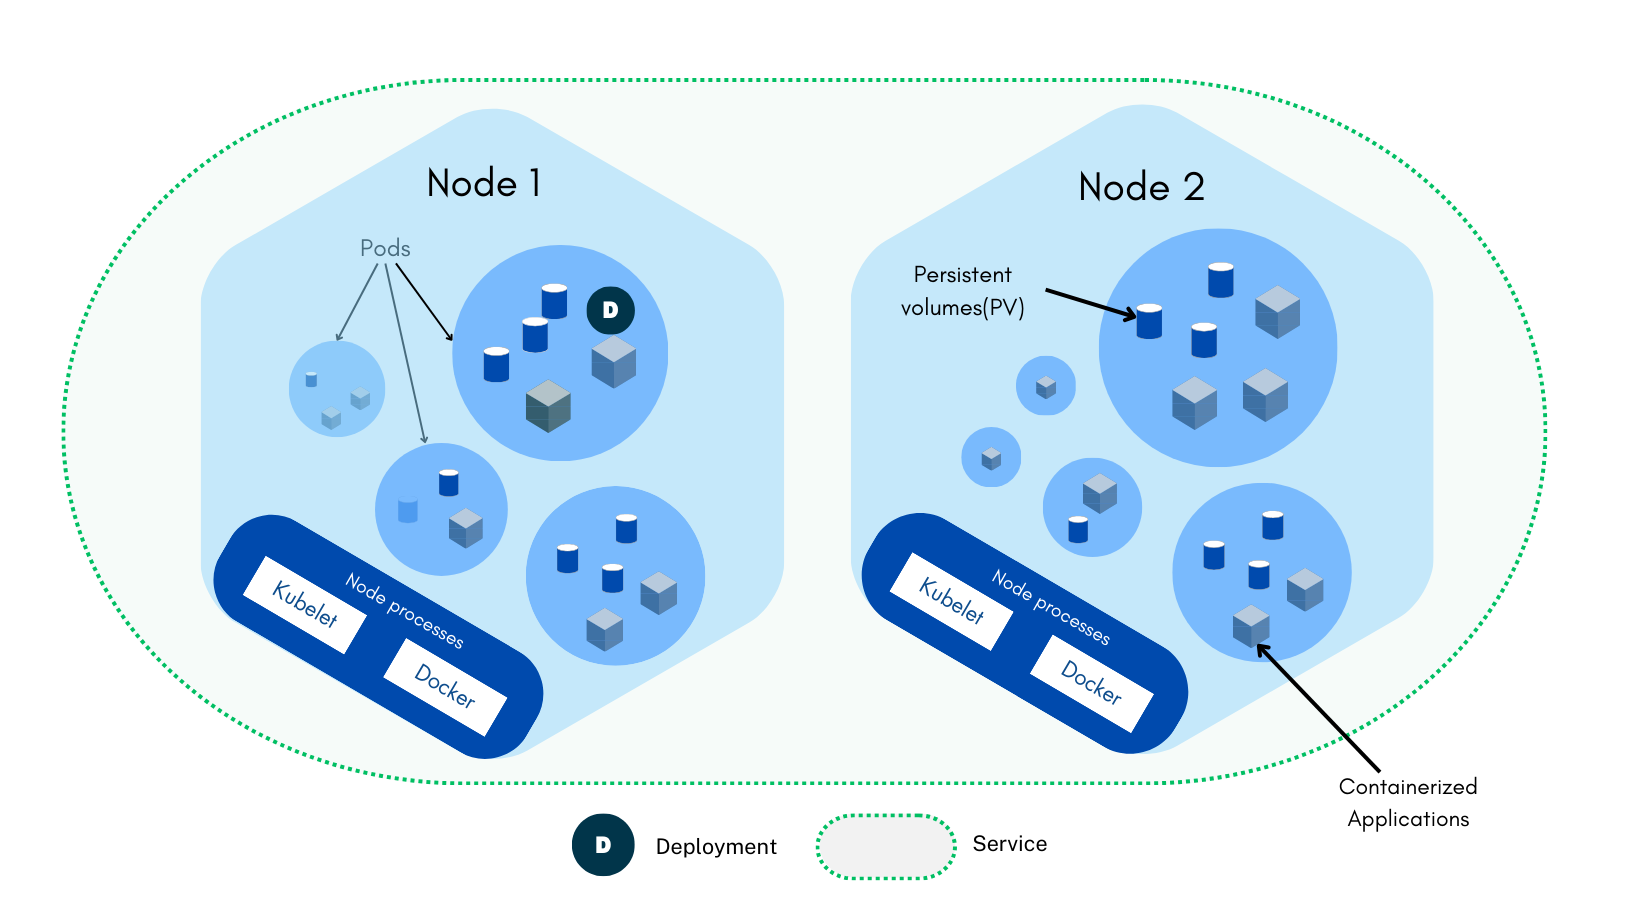
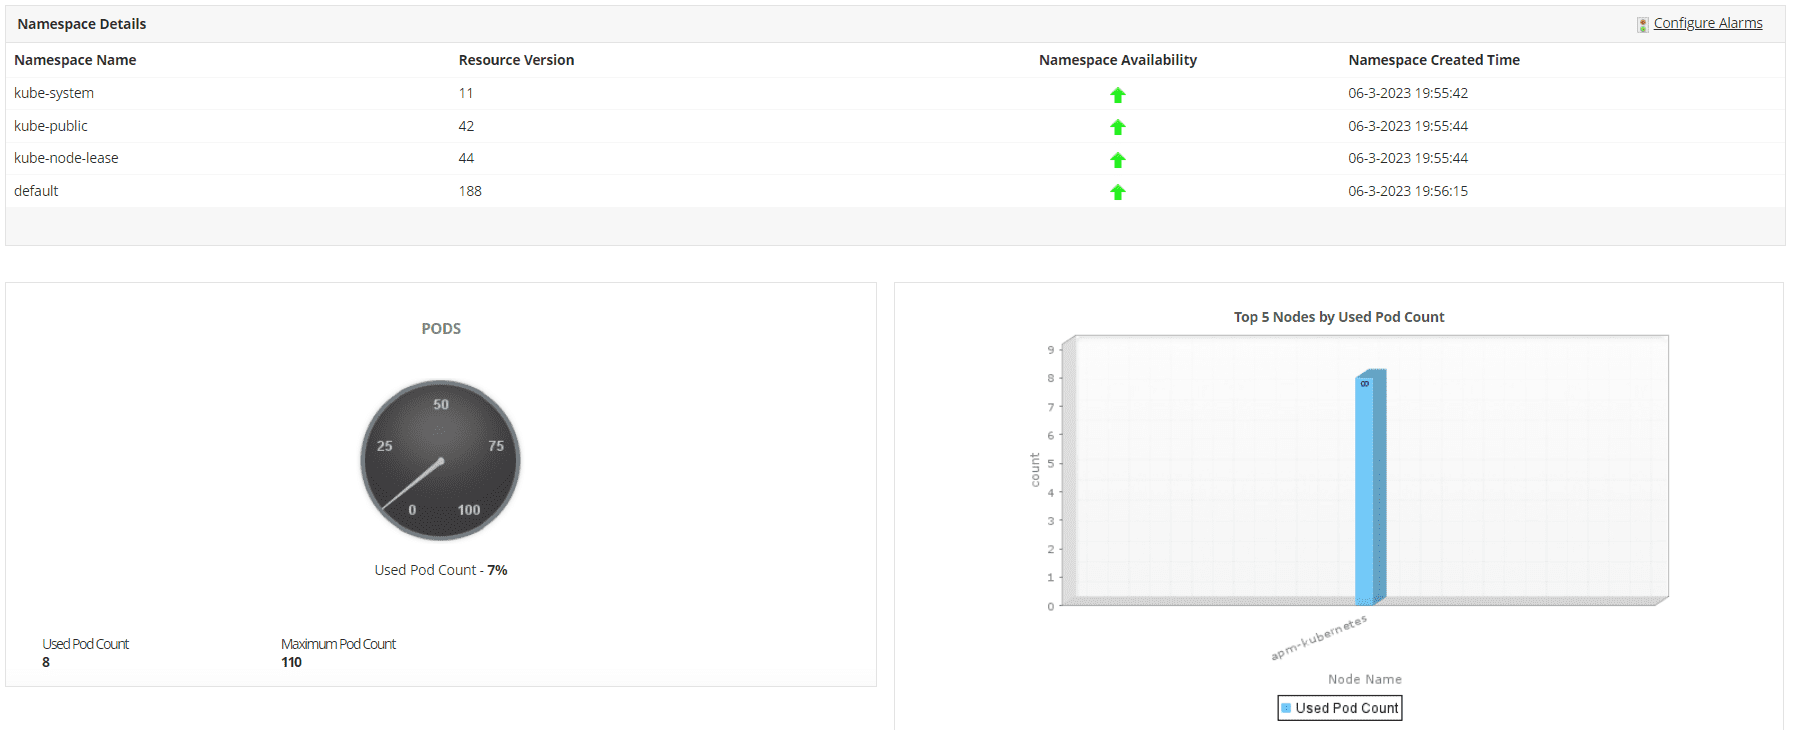
Navigating the intricate Kubernetes landscape requires constant vigilance. Applications Manager's Kubernetes monitor goes beyond mere data gathering, transforming it into actionable intelligence that empowers you to optimize performance, prevent downtime, and ensure the success of your containerized applications. With the Kubernetes monitoring tool, you gain:
Applications Manager provides you the ability to monitor your Kubernetes workloads from the same console, regardless of the cloud provider and whether the service is managed.
Gaining comprehensive oversight of your Kubernetes ecosystem is fundamental for maintaining a healthy, efficient, and reliable containerized environment. It's like having a detailed map and compass to navigate the ever-evolving landscape of your cluster.

While monitoring individual pods and nodes is essential, Kubernetes thrives on its interconnectedness which builds a symphony of vital modules, each playing its part in the overall health and performance of the system. Comprehensive Kubernetes container monitoring necessitates in-depth scrutiny of both the overarching ecosystem and its constituent modules. Applications Manager delivers targeted monitoring capabilities for each module, facilitating a holistic sweep of your containerized environment.
Applications Manager's Kubernetes monitor enables you to,
To ensure the operational excellence of your Kubernetes cluster, it's imperative to establish a proactive monitoring regimen at the control plane level. This involves meticulously tracking key metrics that illuminate the cluster's overall health and performance, empowering you to identify and address potential issues before they impact your applications and users.

Applications Manager's Kubernetes monitor tool automatically discovers Kubernetes clusters in your environment and also allows for manual addition. It provides a centralized dashboard with key metrics for easy reading and comprehension.
Here are some of the key cluster metrics that you can monitor with our Kubernetes monitor:
Nodes serve as the fundamental worker machines within a Kubernetes cluster, hosting containerized workloads (pods). Each node contributes CPU, memory, storage, and network resources to the cluster, enabling pods to function. Delve deeper into Kubernetes performance by scrutinizing individual nodes for resource utilization. Metrics like CPU and memory usage, disk I/O, and network traffic paint a vivid picture of node performance, allowing proactive identification of overloaded nodes or impending resource exhaustion. Maintaining node health ensures smooth operation and prevents service disruptions.

Here are some of the key node metrics that you can monitor with our Kubernetes monitor:
Pods, the microservice workhorses, deserve dedicated attention. Studying pods can help you catch small abnormalities before they snowball into major disruptions, and also identify areas for improvement. Monitoring pod restarts and failures pinpoints areas of instability, while resource requests and limits foster optimal allocation and prevent resource conflicts. Granular insights into container-level CPU and memory usage can help further optimize resource utilization and application performance.

Here are some of the key pod metrics that you can monitor with our Kubernetes monitor:
Monitoring services and deployments is crucial for ensuring the health, performance, and reliability of your Kubernetes-based applications.

Applications Manager's Kubernetes monitor equips you with the following information:
Persistent Volumes ensure your application's data survives pod restarts, node failures, and even cluster upgrades, unlike the ephemeral storage that disappears with the pod. By tracking PV and PVC resources, you can identify bottlenecks and optimize allocation. By monitoring PV access modes, you can ensure the absence of mismatched access modes as it can prevent pods from accessing the data.

Applications Manager's Kubernetes monitor equips you with the following information:
By leveraging the application performance monitoring capabilities in Applications Manager, you can monitor the performance of the applications deployed on Kubernetes and investigate anomalies without additional development effort. Dive deep into application level metrics, business transactions generating multiple service requests, JVM metrics, and more in dev, QA, or production environments. Make use of distributed tracing and AI-powered anomaly detection to isolate errors in microservices-based or other distributed applications deployed on Kubernetes.
If your organization has implemented a service mesh technology, such as Istio, to manage production Kubernetes clusters and the applications that run within them, you need to keep an eye on the performance of the service mesh architecture also. Applications Manager's Istio monitoring capabilities enables you to track essential Istio metrics, including service health, traffic flow, resource utilization, and more, providing a holistic view of your service mesh's health and performance. Gain unparalleled insights into the inner workings of your service mesh to execute informed decision-making and proactive optimization.
Our real-time dashboards, customizable alerts, and powerful root cause analysis tools equip you to proactively address issues before they impact users. By empowering you with intelligent insights, proactive management, and automated actions, it sets your containerized ecosystem on course for optimal functioning.
Instill a collaborative performance culture across development, platform engineering, and SRE teams. Through unified data and collaborative workflows, optimize code, identify bottlenecks, and deliver exceptional user experiences.
With Applications Manager's Kubernetes monitor, fueled by data-driven insights, you can diligently monitor these crucial modules and components and establish a proactive and comprehensive approach to Kubernetes management. It helps you identify resource bottlenecks and under-utilization, enabling strategic allocation and cost-effective utilization. Ensure cluster resilience by monitoring node failures, pod disruptions, and network hiccups. Find impending issues before they manifest and take proactive measures to avoid downtime and maintain uninterrupted operations.
It allows us to track crucial metrics such as response times, resource utilization, error rates, and transaction performance. The real-time monitoring alerts promptly notify us of any issues or anomalies, enabling us to take immediate action.
Reviewer Role: Research and Development