Understand incident impact in seconds
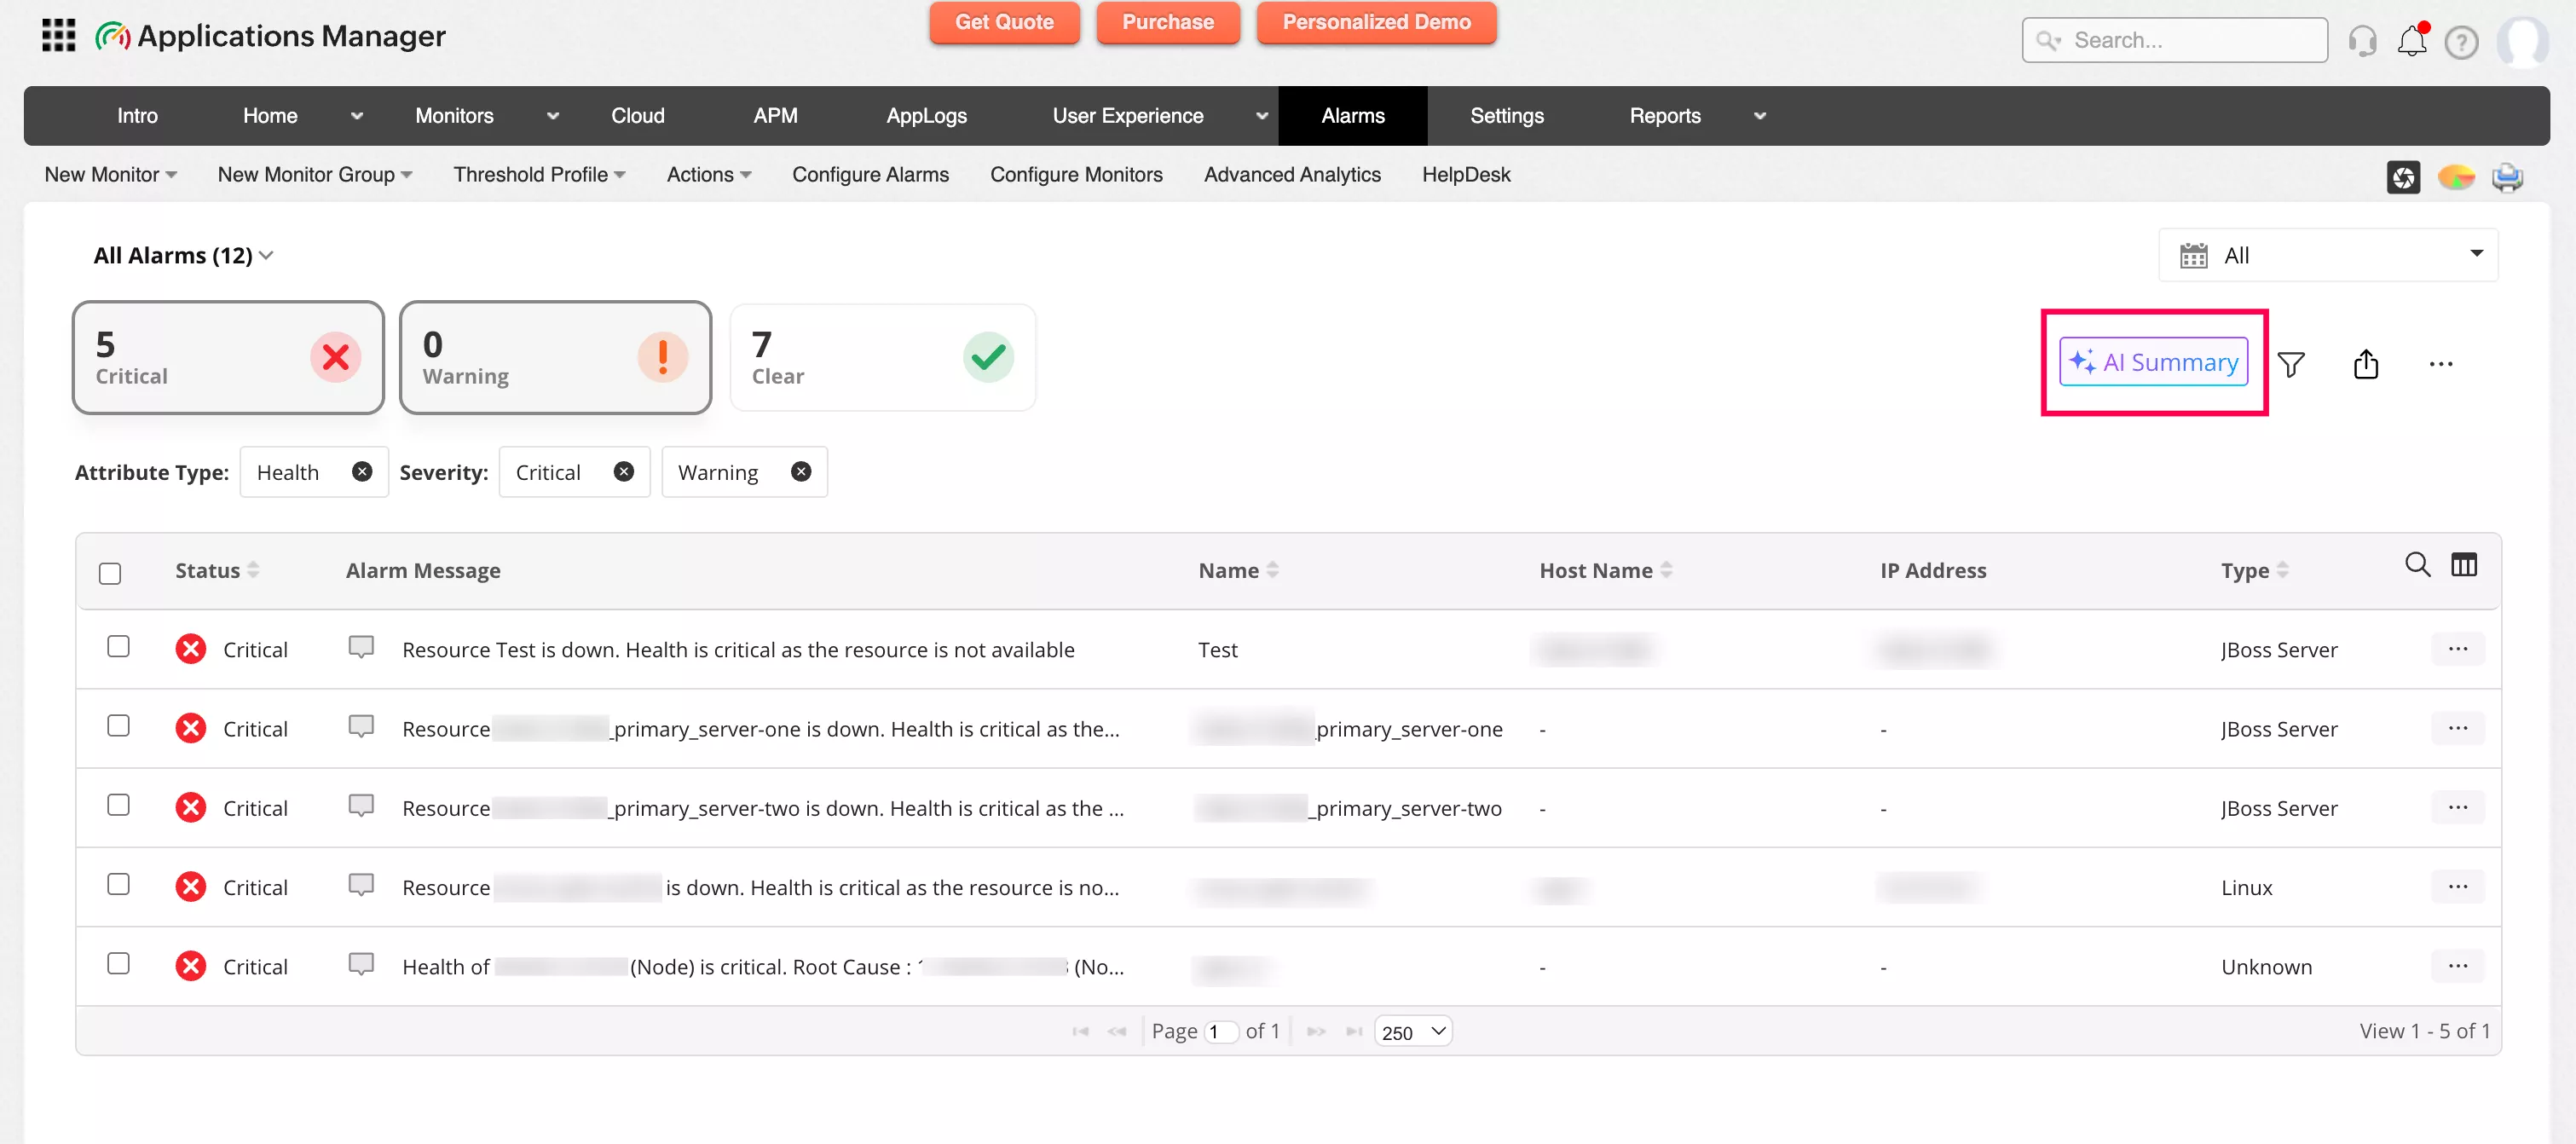
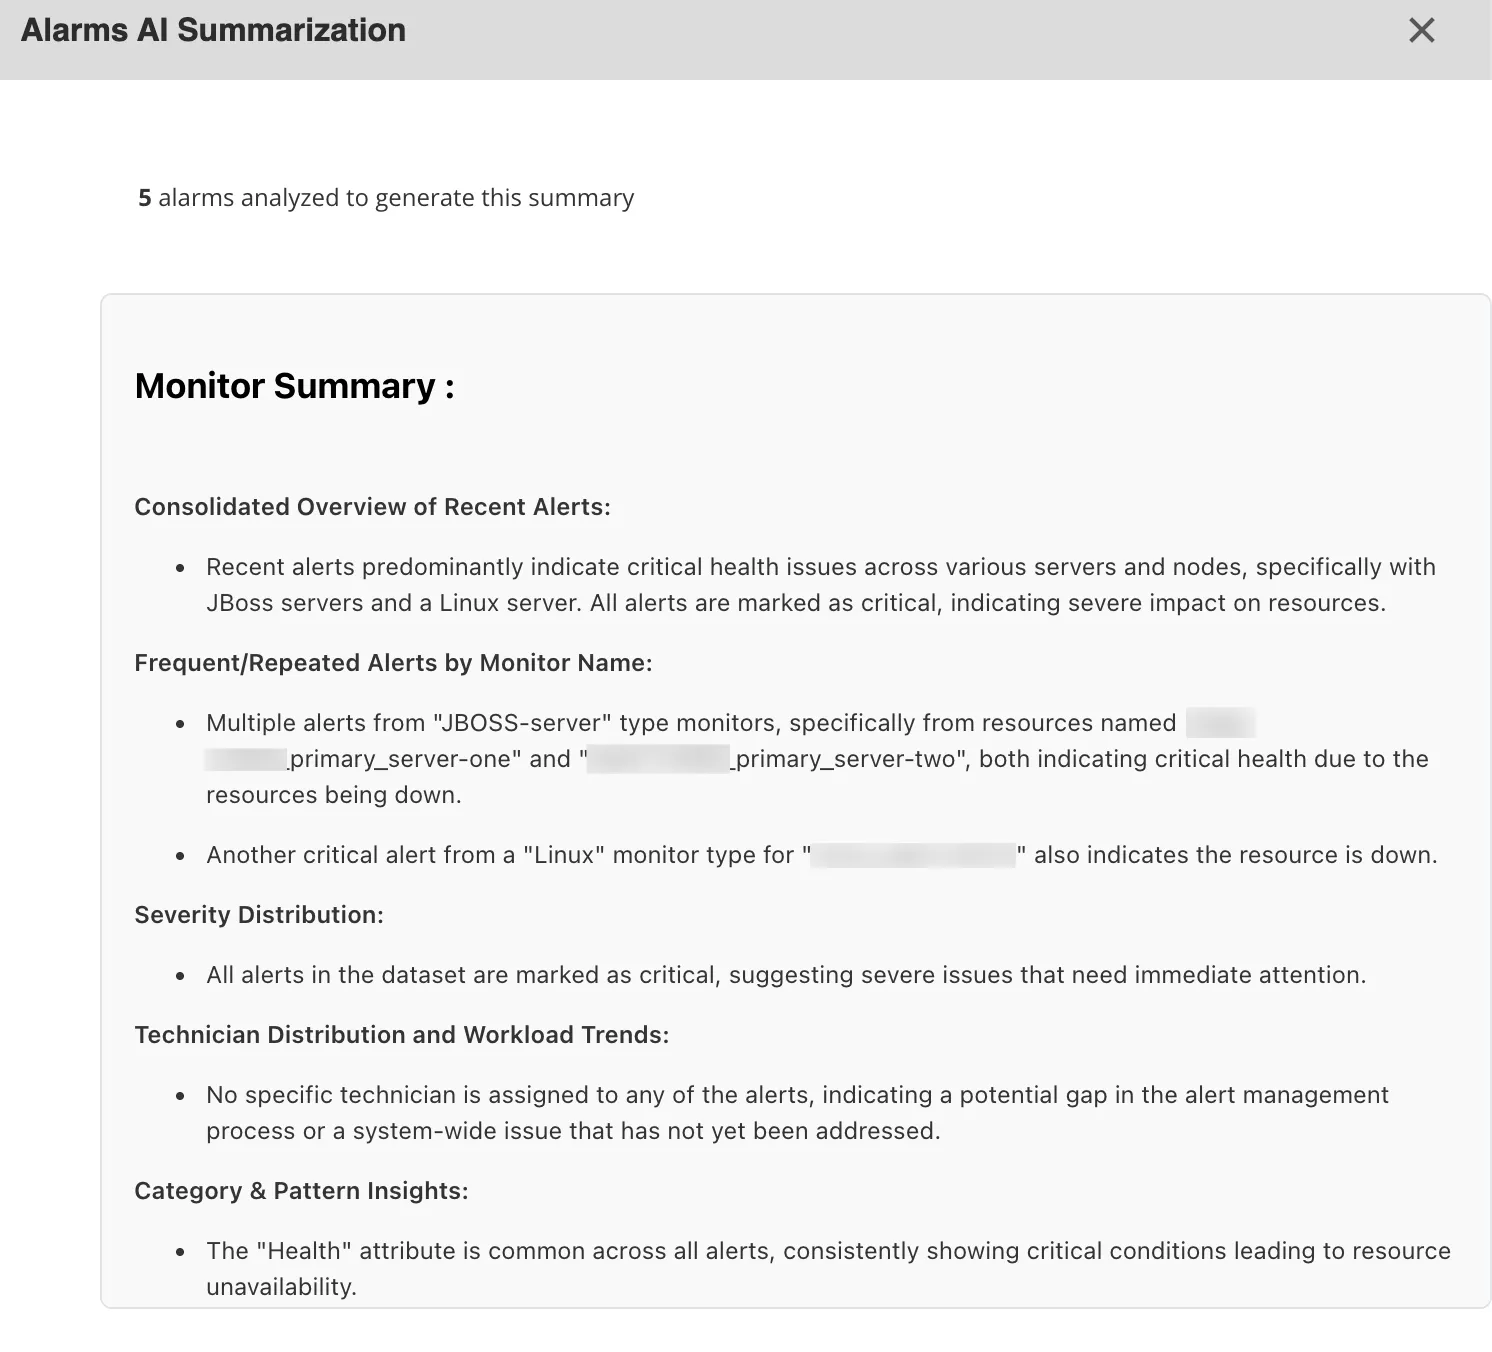
See the full scope of an incident without reviewing hundreds of individual alerts. Related alarms are automatically correlated into a clear incident view, helping teams identify the primary issue and avoid distractions caused by secondary symptoms.
Reduce alert noise at scale
By grouping and correlating alarms across monitors, the AI-powered summary reduces noise and eliminates the need to manually inspect multiple dashboards. Teams spend less time analyzing alerts and more time resolving issues.
Find recurring issues before they escalate
Historical alarm analysis uncovers repeating failures, time-based anomalies, and hidden operational trends. By surfacing these patterns clearly, teams can address persistent issues early and prevent downtime before it starts.
Identify root-causes faster
Alarms are correlated across applications, servers, databases, and infrastructure components. Instead of isolated alerts, teams see how issues relate; making it easier to pinpoint root causes and avoid chasing symptoms.
Stay focused during high-pressure incidents
One unified view surfaces the patterns, severity, and impacted components that matter most; so teams switch less, think clearer, and make faster decisions when every second counts.
Spend time fixing, not filtering
Manual alert correlation is slow and error-prone. AI-powered alarm summary automates analysis so teams can focus on remediation instead of interpreting raw data.

Prioritize incidents with confidence
Clear severity distribution and health indicators help teams assess real impact. This enables smarter incident prioritization and better resource allocation during both planned work and unexpected outages.
Guided remediation, built in
Structured incident timelines show how issues evolved and which dependencies were affected. Teams can plan recovery steps with confidence, reduce unnecessary service restarts, and improve consistency across responders; especially during complex outages.
Types of alert summaries provided by Applications Manager
To cater to different operational needs, Applications Manager provides four distinct AI alarm summary types. Each kind serves its own purpose during troubleshooting:
| Summary Type |
What it is |
How it helps |
| Consolidated Summary |
A bird’s-eye view of every alarm currently on your screen. |
Strategic oversight: Perfect for shift handovers or morning briefings. It gives you a "State of the Union" of the entire infrastructure in seconds. |
| Selected Summary |
A targeted analysis of specific alarms you manually highlight. |
Focused troubleshooting: When you suspect a specific set of microservices is failing, this strips away the background noise to focus only on those specific variables. |
| Monitor Group Summary |
A 14-day trend report for a specific logical group (e.g., "Finance App" or "Cloud Cluster"). |
Health tracking: Helps you see if a specific department's resources are degrading over time, allowing for proactive capacity planning before a total failure occurs. |
| Individual Alarm Summary |
A deep-dive forensic look at one specific alert and its 30-day history. |
Root cause analysis: This is the "detective" mode. It provides the probable cause, history, and a step-by-step automation workflow to resolve the issue. |

This feature removes the cognitive load of data processing. By providing cliff notes for your infrastructure, Applications Manager's AI alert summary allows your team to rather focus on high-value architecture than endless firefighting.
Upgrade to the latest version of Applications Manager to enjoy a seamless IT monitoring experience. Learn how to configure AI Alarms Summary in your console here.


